Antero Midstream Partners Mergers and Acquisitions Presentation Deck
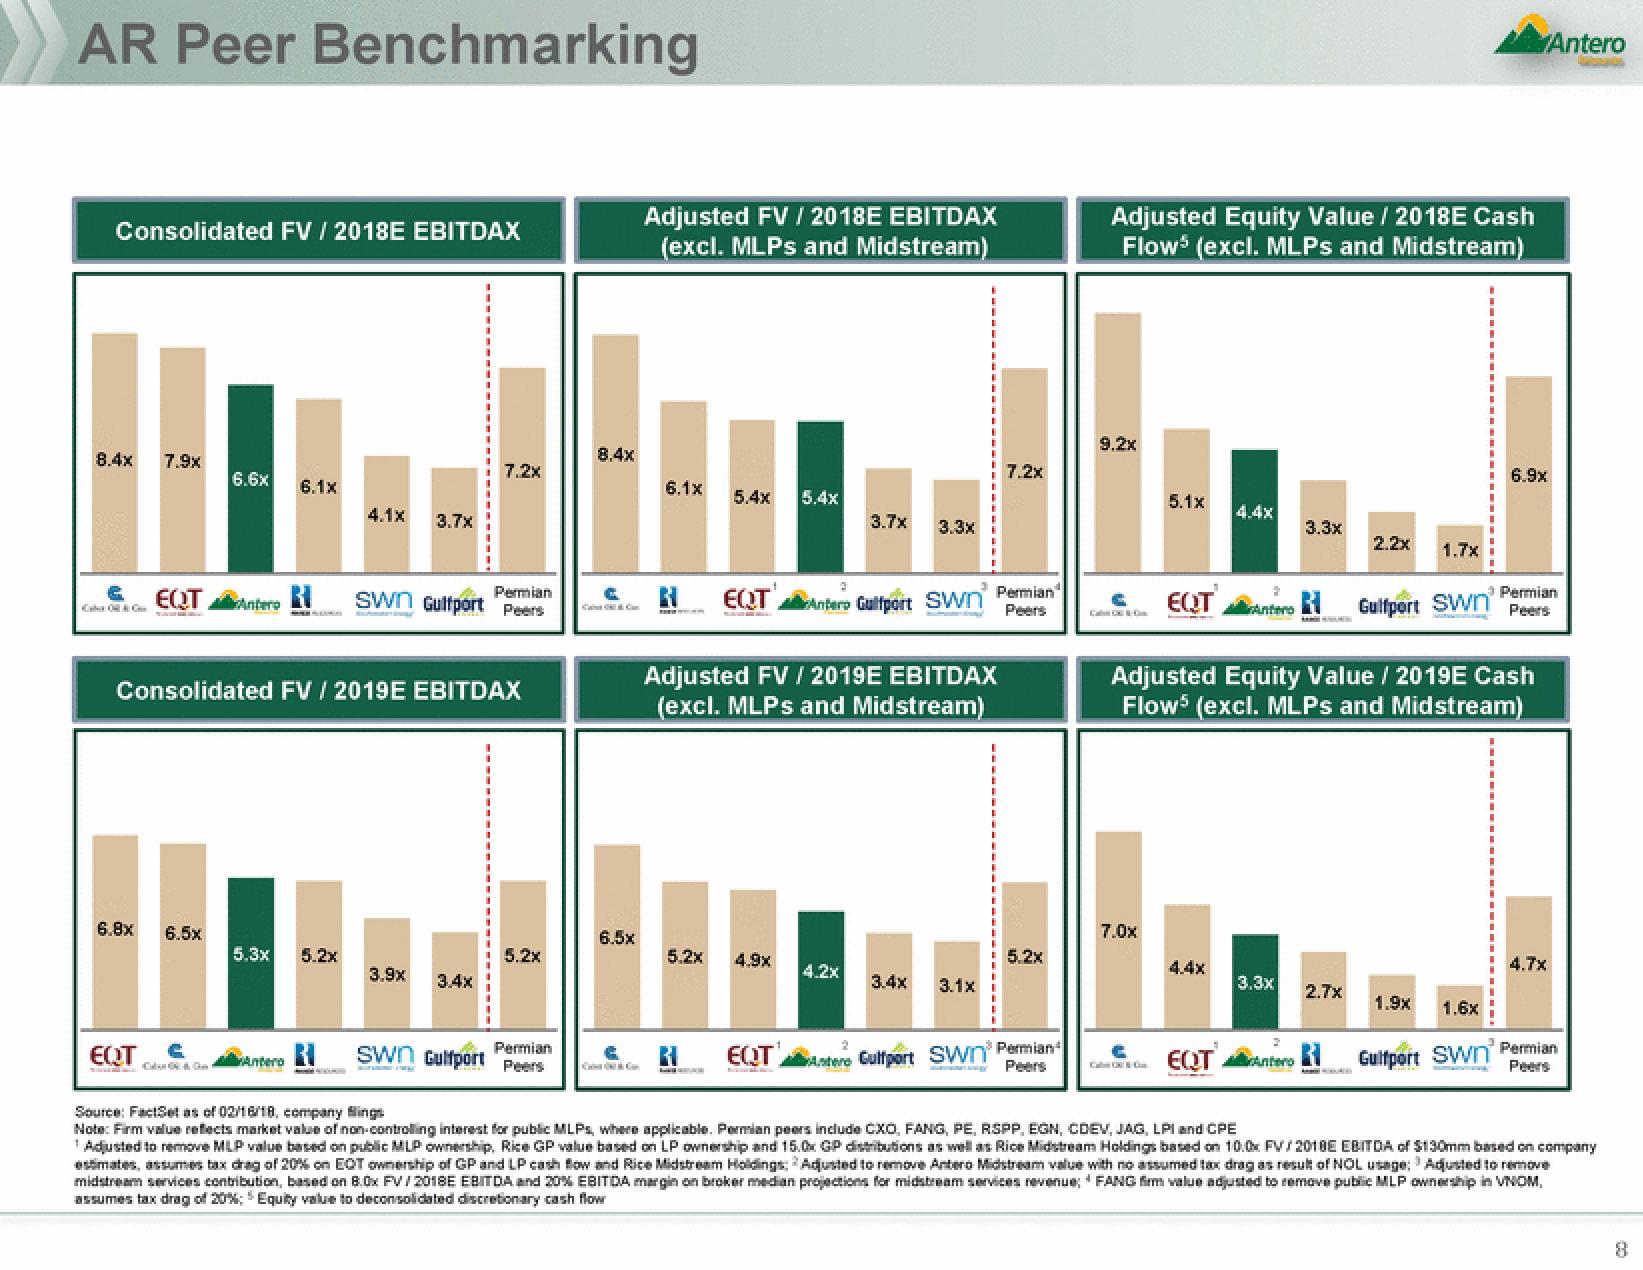
AR Peer Benchmarking
Consolidated FV / 2018E EBITDAX
8.4x
2
đam m
7.9x
EQT
EQT
6.8x 6.5x
6.6x
intero
6.1x
5.3x 5.2x
Antero
4.1x
Consolidated FV / 2019E EBITDAX
3.7x
Permian
swn Gulfport Peers
3.9x
7.2x
3.4x
5.2x
Permian
swn Gulfport Pers
8.4x
6.5x
Adjusted FV / 2018E EBITDAX
(excl. MLPs and Midstream)
6.1x
5.2x
5.4x 5.4x
RI
EQT
Adjusted FV / 2019E EBITDAX
(excl. MLPs and Midstream)
4.9x
3.7x 3.3x
Antero Gulfport Swn
4.2x
3.4x 3.1x
7.2x
Permian
Peers
5.2x
2
EQT Antero Gulfport Swn Permian
Peers
Adjusted Equity Value / 2018E Cash
Flows (excl. MLPs and Midstream)
Cam
5.1x
7.0x
EQT
4.4x
4.4x
S
counterno
3.3x
KARE ZA S
EQT Ant
3.3x 2.7x
2.2x
Adjusted Equity Value / 2019E Cash
Flows (excl. MLPs and Midstream)
RI
1.7x
Gulfport Swn'
1.9x 1.6x
Gulfport Swn'
Antero
6.9x
Permian
Peers
4.7x
Permian
Peers
Source: FactSet as of 02/16/18, company Slings
Note: Firm value reflects market value of non-controlling interest for public MLPs, where applicable. Permian peers include CXO, FANG, PE, RSPP, EGN, CDEV, JAG, LPI and CPE
¹ Adjusted to remove MLP value based on public MLP ownership, Rice GP value based on LP ownership and 15.0x GP distributions as well as Rice Midstream Holdings based on 10.0x FV/2010E EBITDA of $130mm based on company
estimates, assumes tax drag of 20% on EQT ownership of GP and LP cash flow and Rice Midstream Holdings: Adjusted to remove Antero Midstream value with no assumed tax drag as result of NOL usage: Adjusted to remove
midstream services contribution, based on 8.0x FV/2018E EBITDA and 20% EBITDA margin on broker median projections for midstream services revenue; FANG firm value adjusted to remove public MLP ownership in VNOM,
assumes tax drag of 20%; Equity value to deconsolidated discretionary cash flow
3
8View entire presentation