Investor Deep Dive Corporate Bank
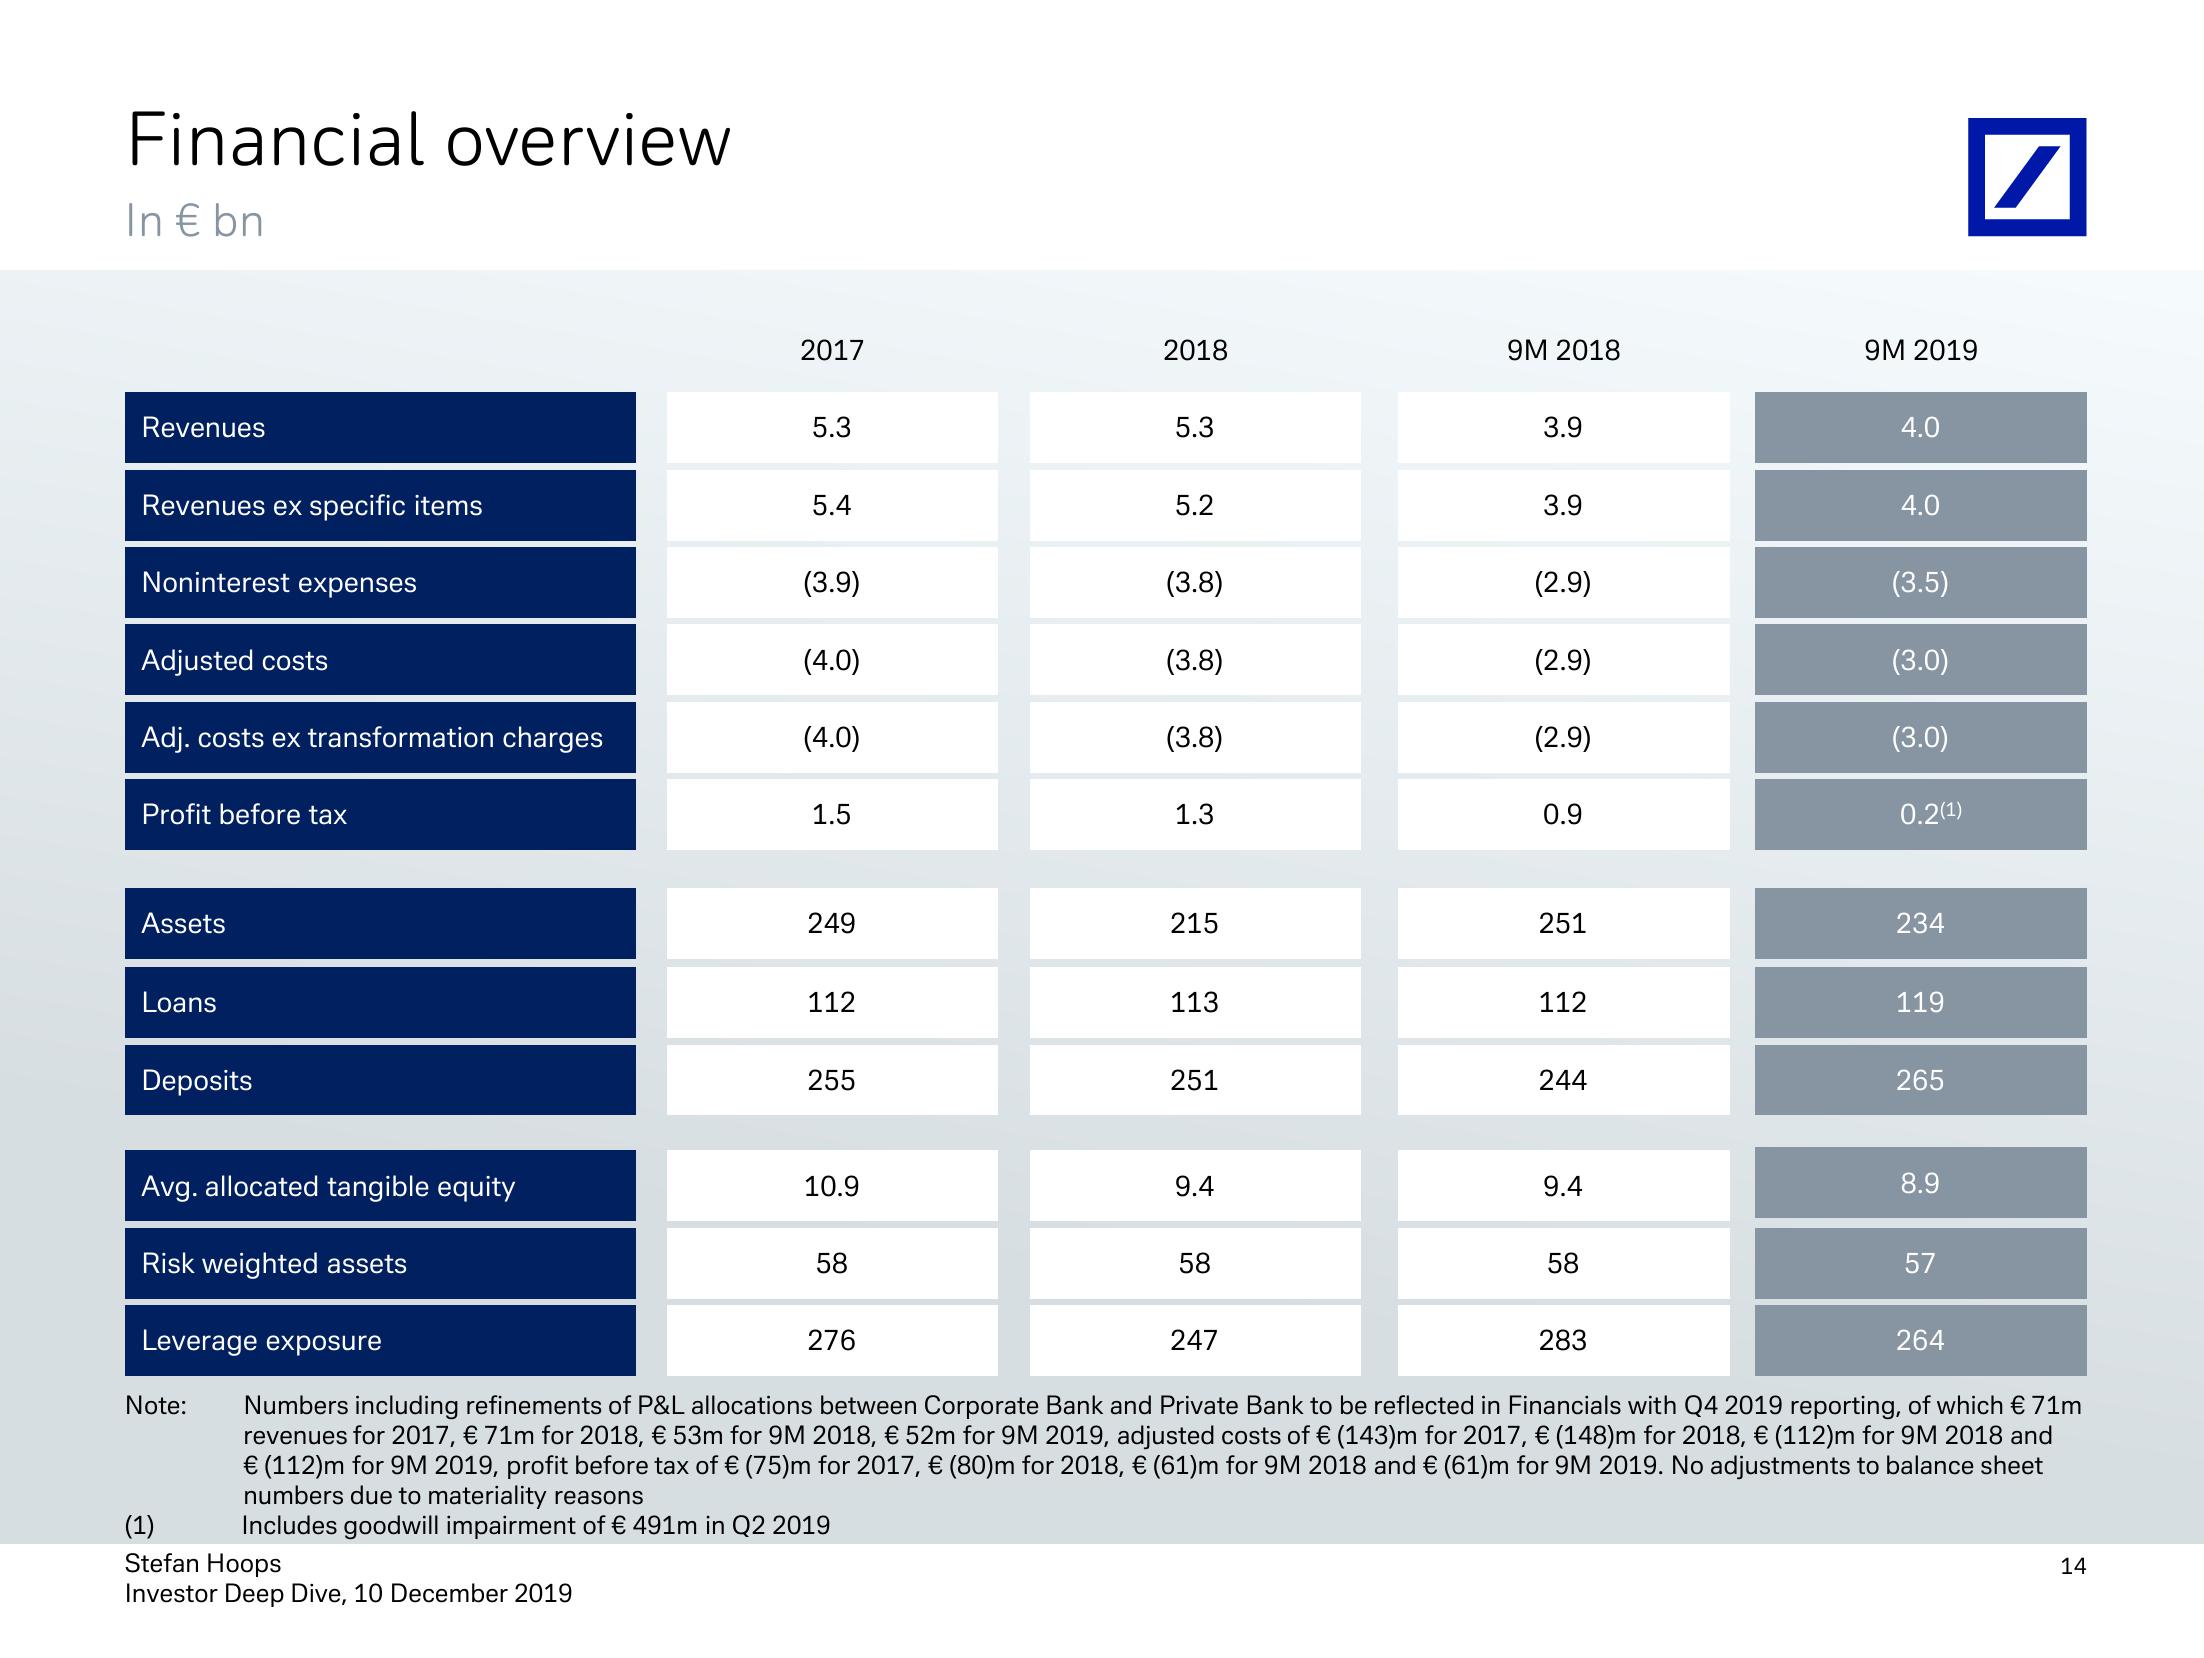
Financial overview
In € bn
2017
2018
9M 2018
9M 2019
Revenues
5.3
5.3
3.9
4.0
Revenues ex specific items
5.4
5.2
3.9
4.0
Noninterest expenses
(3.9)
(3.8)
(2.9)
(3.5)
Adjusted costs
(4.0)
(3.8)
(2.9)
(3.0)
Adj. costs ex transformation charges
(4.0)
(3.8)
(2.9)
(3.0)
Profit before tax
1.5
1.3
0.9
0.2(1)
Assets
Loans
Deposits
249
215
251
234
112
113
112
119
255
251
244
265
Avg. allocated tangible equity
10.9
9.4
9.4
8.9
Risk weighted assets
58
58
58
57
Leverage exposure
276
247
283
264
Note:
(1)
Numbers including refinements of P&L allocations between Corporate Bank and Private Bank to be reflected in Financials with Q4 2019 reporting, of which € 71m
revenues for 2017, € 71m for 2018, € 53m for 9M 2018, € 52m for 9M 2019, adjusted costs of € (143)m for 2017, € (148)m for 2018, € (112)m for 9M 2018 and
€ (112)m for 9M 2019, profit before tax of € (75)m for 2017, € (80)m for 2018, € (61)m for 9M 2018 and € (61)m for 9M 2019. No adjustments to balance sheet
numbers due to materiality reasons
Includes goodwill impairment of € 491m in Q2 2019
Stefan Hoops
Investor Deep Dive, 10 December 2019
14View entire presentation