Despegar Results Presentation Deck
Generated $6.5 M in Net Cash Flow and $29.2 M in Cash Flow from
Operations
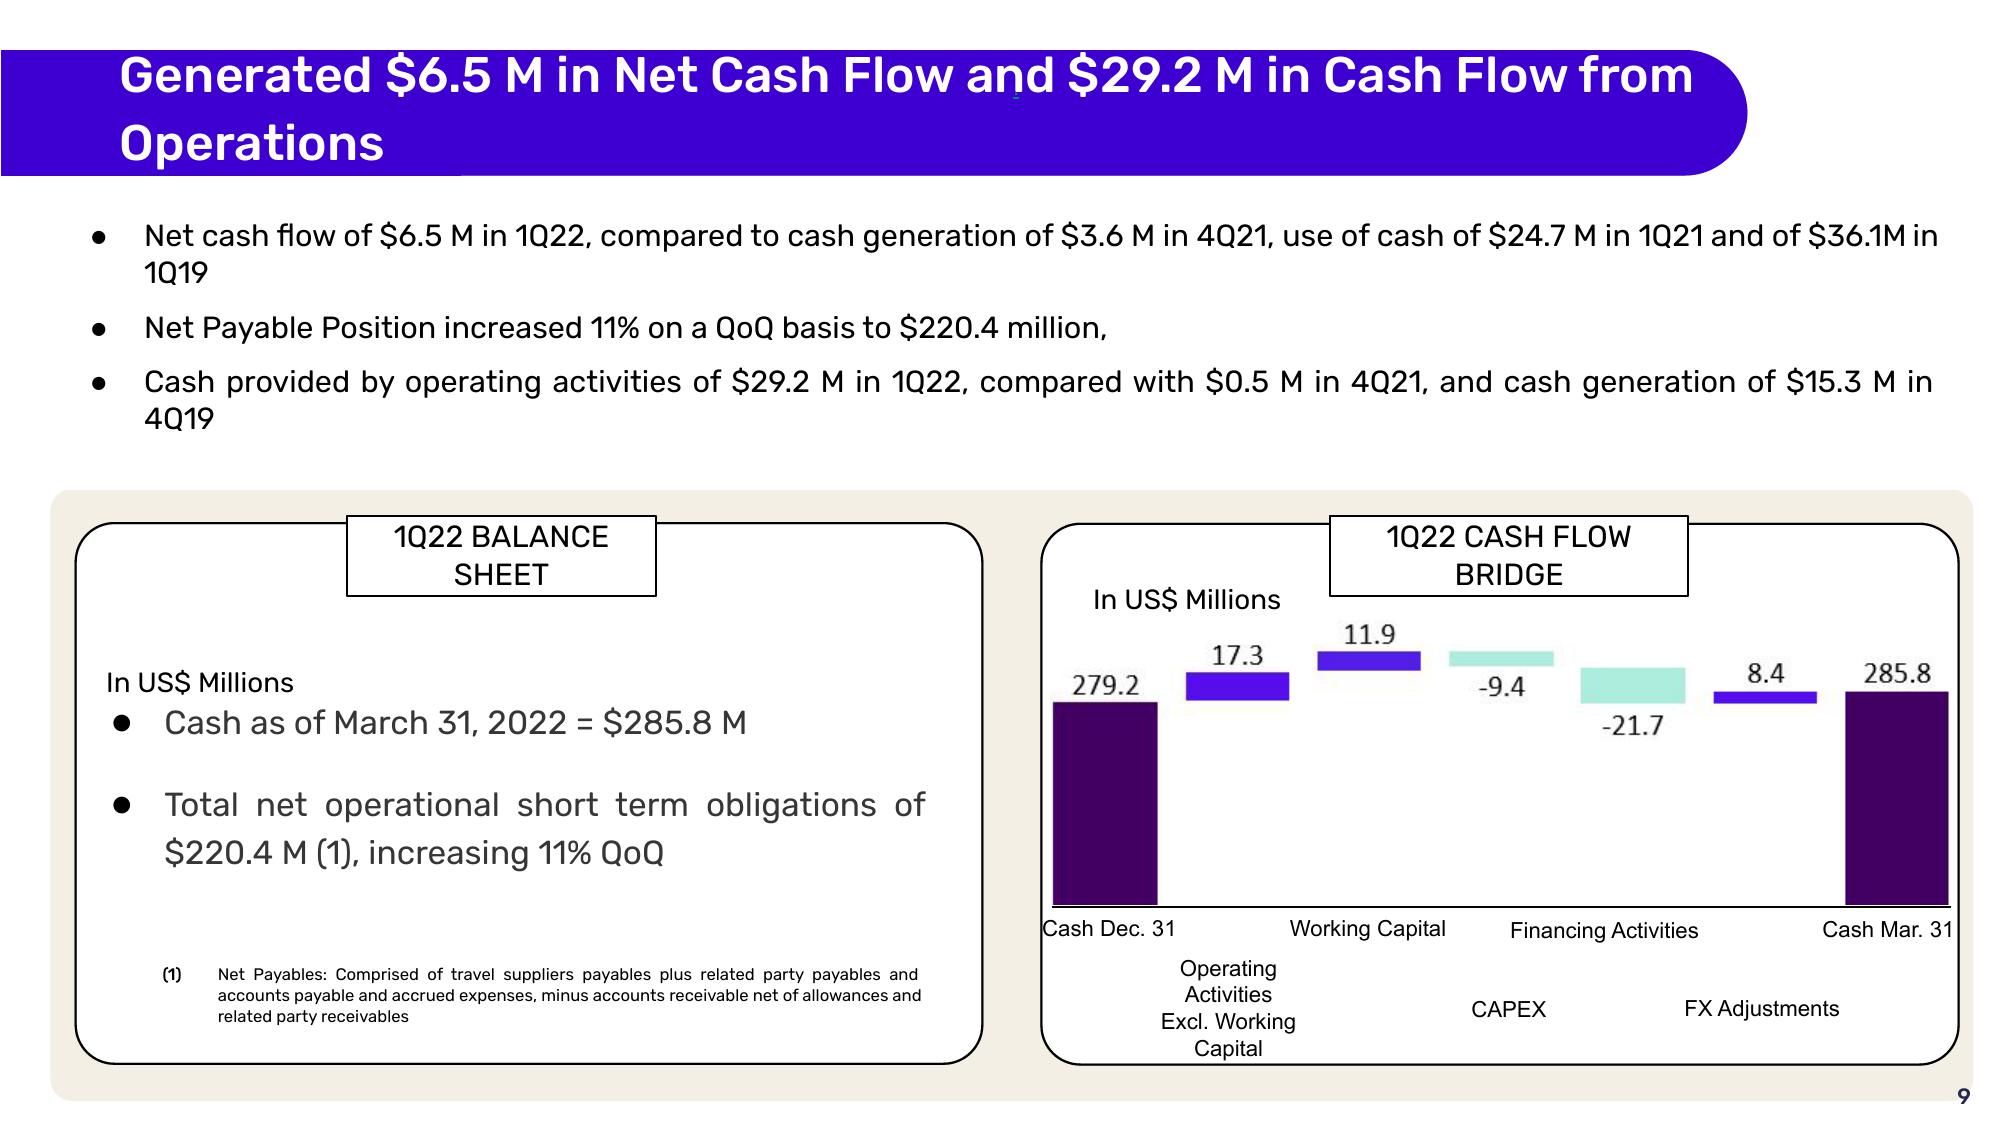
Net cash flow of $6.5 M in 1022, compared to cash generation of $3.6 M in 4Q21, use of cash of $24.7 M in 1021 and of $36.1M in
1019
Net Payable Position increased 11% on a QoQ basis to $220.4 million,
Cash provided by operating activities of $29.2 M in 1022, compared with $0.5 M in 4Q21, and cash generation of $15.3 M in
4Q19
1022 BALANCE
SHEET
In US$ Millions
Cash as of March 31, 2022 = $285.8 M
Total net operational short term obligations of
$220.4 M (1), increasing 11% QOQ
(1)
Net Payables: Comprised of travel suppliers payables plus related party payables and
accounts payable and accrued expenses, minus accounts receivable net of allowances and
related party receivables
In US$ Millions
17.3
279.2
Cash Dec. 31
Operating
Activities
1022 CASH FLOW
BRIDGE
Excl. Working
Capital
11.9
Working Capital
-9.4
-21.7
Financing Activities
CAPEX
8.4
285.8
Cash Mar. 31
FX Adjustments
9View entire presentation