Cytek Investor Day Presentation Deck
Cell Y Position
12400-
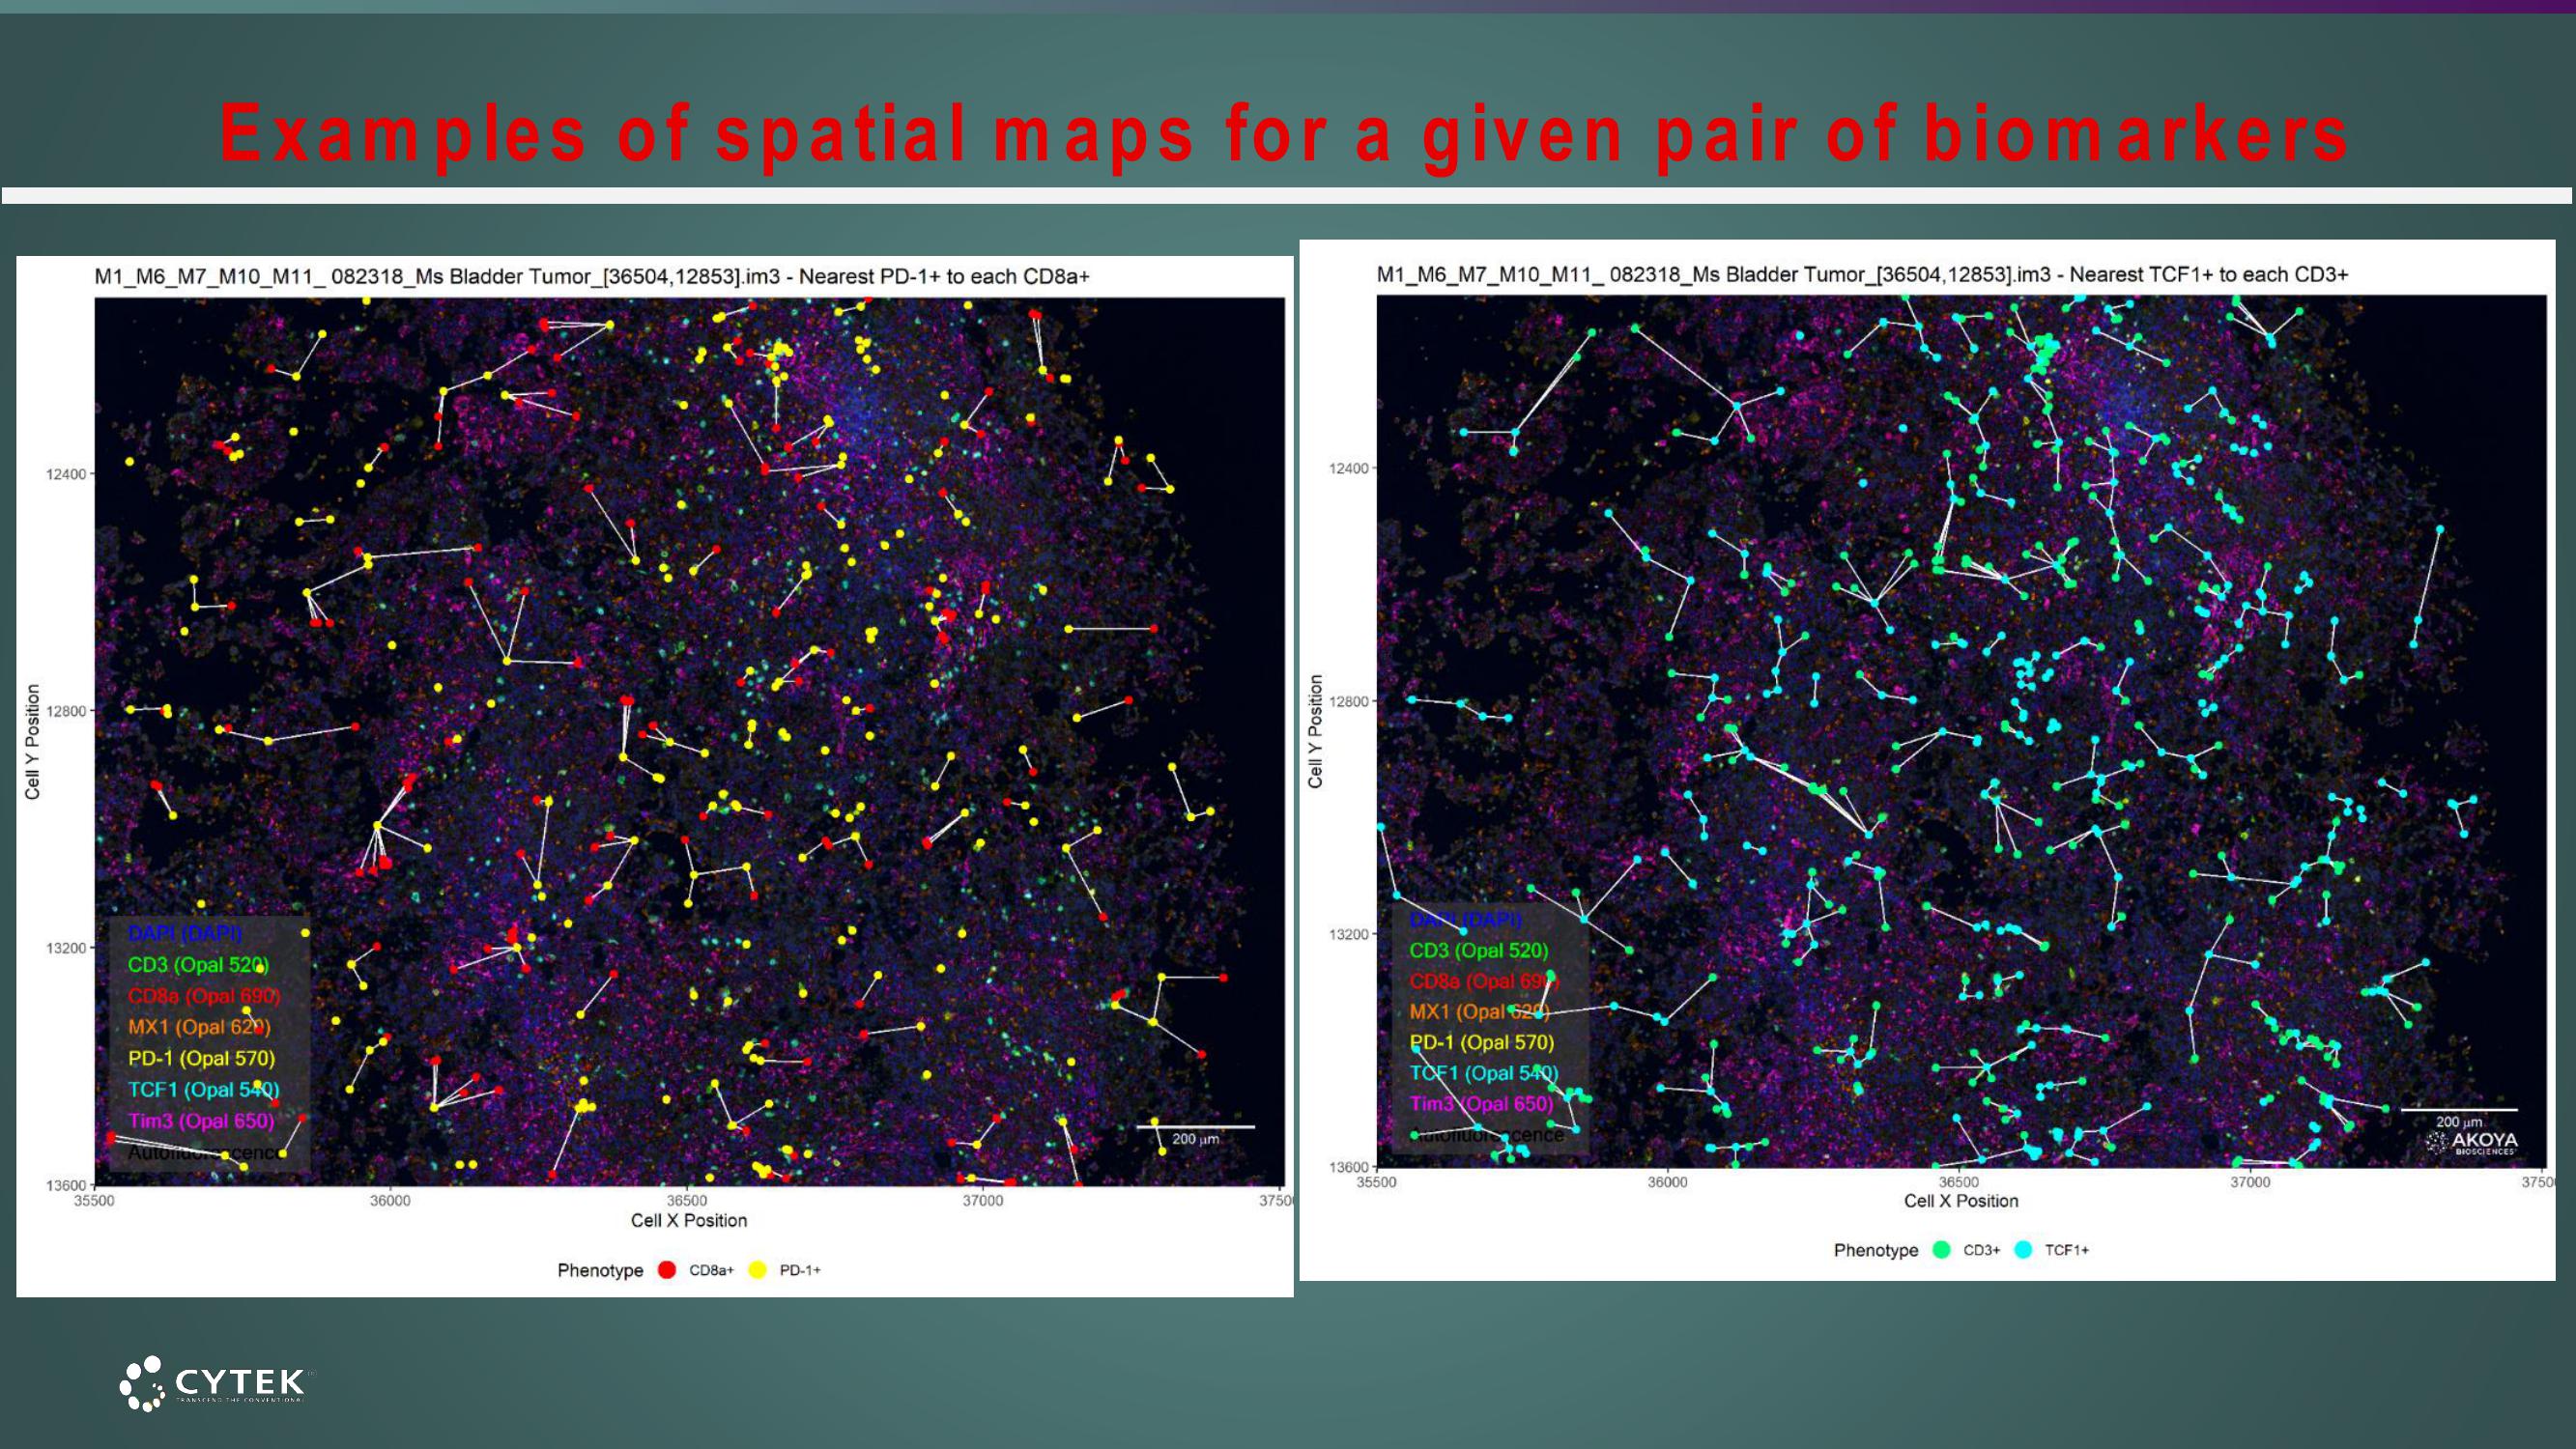
M1 M6 M7 M10 M11_082318_Ms Bladder Tumor_[36504,12853].im3 - Nearest PD-1+ to each CD8a+
12800-
13200-
13600
Examples of spatial maps for a given pair of biomarkers
35500
DAPI (DAPI)
CD3 (Opal 520)
CD8a (Opal 690)
MX1 (Opal 620)
PD-1 (Opal 570)
TCF1 (Opal 540)
Tim3 (Opal 650)
Autondon cenco
CYTEK
TRANSCEND THE CONVENTIONA
36000
36500
Cell X Position
Phenotype CD8a+
PD-1+
37000
200 μm
3750
Cell Y Position
M1 M6 M7 M10 M11_082318_Ms Bladder Tumor_[36504,12853].im3 - Nearest TCF1+ to each CD3+
12400-
12800-
13200-
13600-
35500
(DAPI)
CD3 (Opal 520)
CD88 (Opal 69
MX1 (Opal 620d)
PD-1 (Opal 570)
TOF1 (Opal 540)
Tim3 Opal 650)
ramofitorcence
36000
36500
Cell X Position
Phenotype
CD3+
TCF1+
37000
200 μm.
AKOYA
BIOSCIENCES
3750View entire presentation