First Foundation Investor Presentation Deck
Our Multifamily Expertise
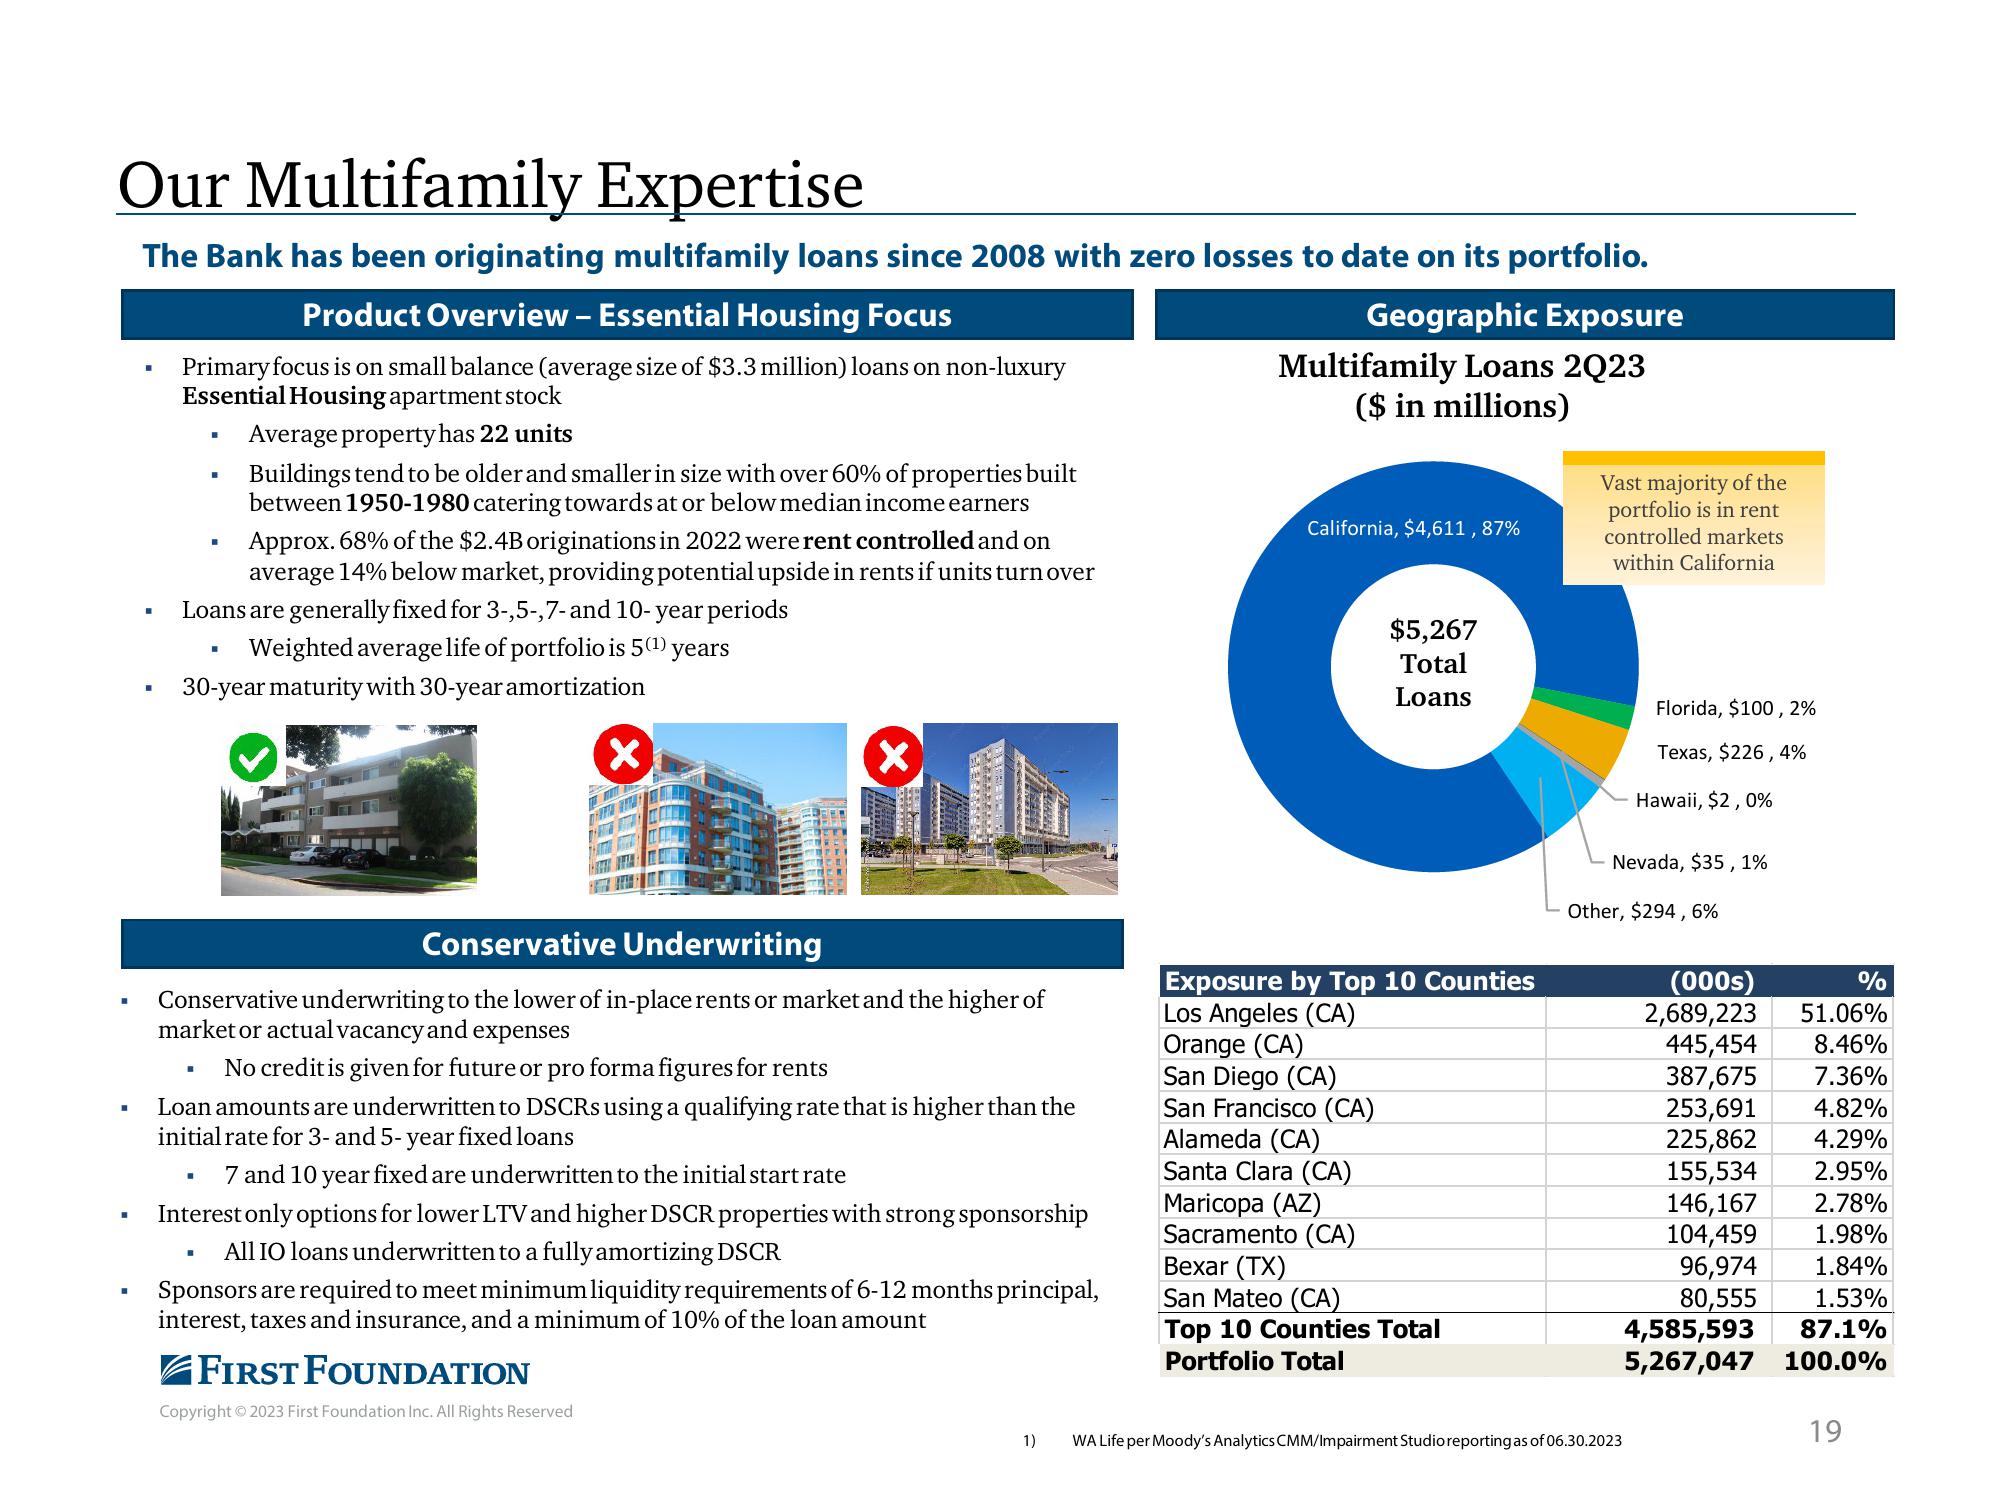
The Bank has been originating multifamily loans since 2008 with zero losses to date on its portfolio.
.
■
■
■
.
■
Product Overview - Essential Housing Focus
Primary focus is on small balance (average size of $3.3 million) loans on non-luxury
Essential Housing apartment stock
Average property has 22 units
■
■
■
■
Loans are generally fixed for 3-,5-,7- and 10-year periods
Weighted average life of portfolio is 5 (¹) years
·
Buildings tend to be older and smaller in size with over 60% of properties built
between 1950-1980 catering towards at or below median income earners
30-year maturity with 30-year amortization
Approx. 68% of the $2.4B originations in 2022 were rent controlled and on
average 14% below market, providing potential upside in rents if units turn over
■
GIM
Conservative Underwriting
Conservative underwriting to the lower of in-place rents or market and the higher of
market or actual vacancy and expenses
No credit is given for future or pro forma figures for rents
X
X
Loan amounts are underwritten to DSCRs using a qualifying rate that is higher than the
initial rate for 3- and 5-year fixed loans
7 and 10 year fixed are underwritten to the initial start rate
PENG
Interest only options for lower LTV and higher DSCR properties with strong sponsorship
All IO loans underwritten to a fully amortizing DSCR
FIRST FOUNDATION
Copyright © 2023 First Foundation Inc. All Rights Reserved
Sponsors are required to meet minimum liquidity requirements of 6-12 months principal,
interest, taxes and insurance, and a minimum of 10% of the loan amount
Geographic Exposure
Multifamily Loans 2Q23
($ in millions)
California, $4,611, 87%
$5,267
Total
Loans
Exposure by Top 10 Counties
Los Angeles (CA)
Orange (CA)
San Diego (CA)
San Francisco (CA)
Alameda (CA)
Santa Clara (CA)
Maricopa (AZ)
Sacramento (CA)
Bexar (TX)
San Mateo (CA)
Top 10 Counties Total
Portfolio Total
Vast majority of the
portfolio is in rent
controlled markets
within California
Florida, $100, 2%
Texas, $226, 4%
Hawaii, $2,0%
Nevada, $35, 1%
Other, $294, 6%
1) WA Life per Moody's Analytics CMM/Impairment Studio reporting as of 06.30.2023
%
51.06%
8.46%
7.36%
4.82%
4.29%
2.95%
2.78%
1.98%
1.84%
1.53%
4,585,593
87.1%
5,267,047 100.0%
(000s)
2,689,223
445,454
387,675
253,691
225,862
155,534
146,167
104,459
96,974
80,555
19View entire presentation