Investor Presentation
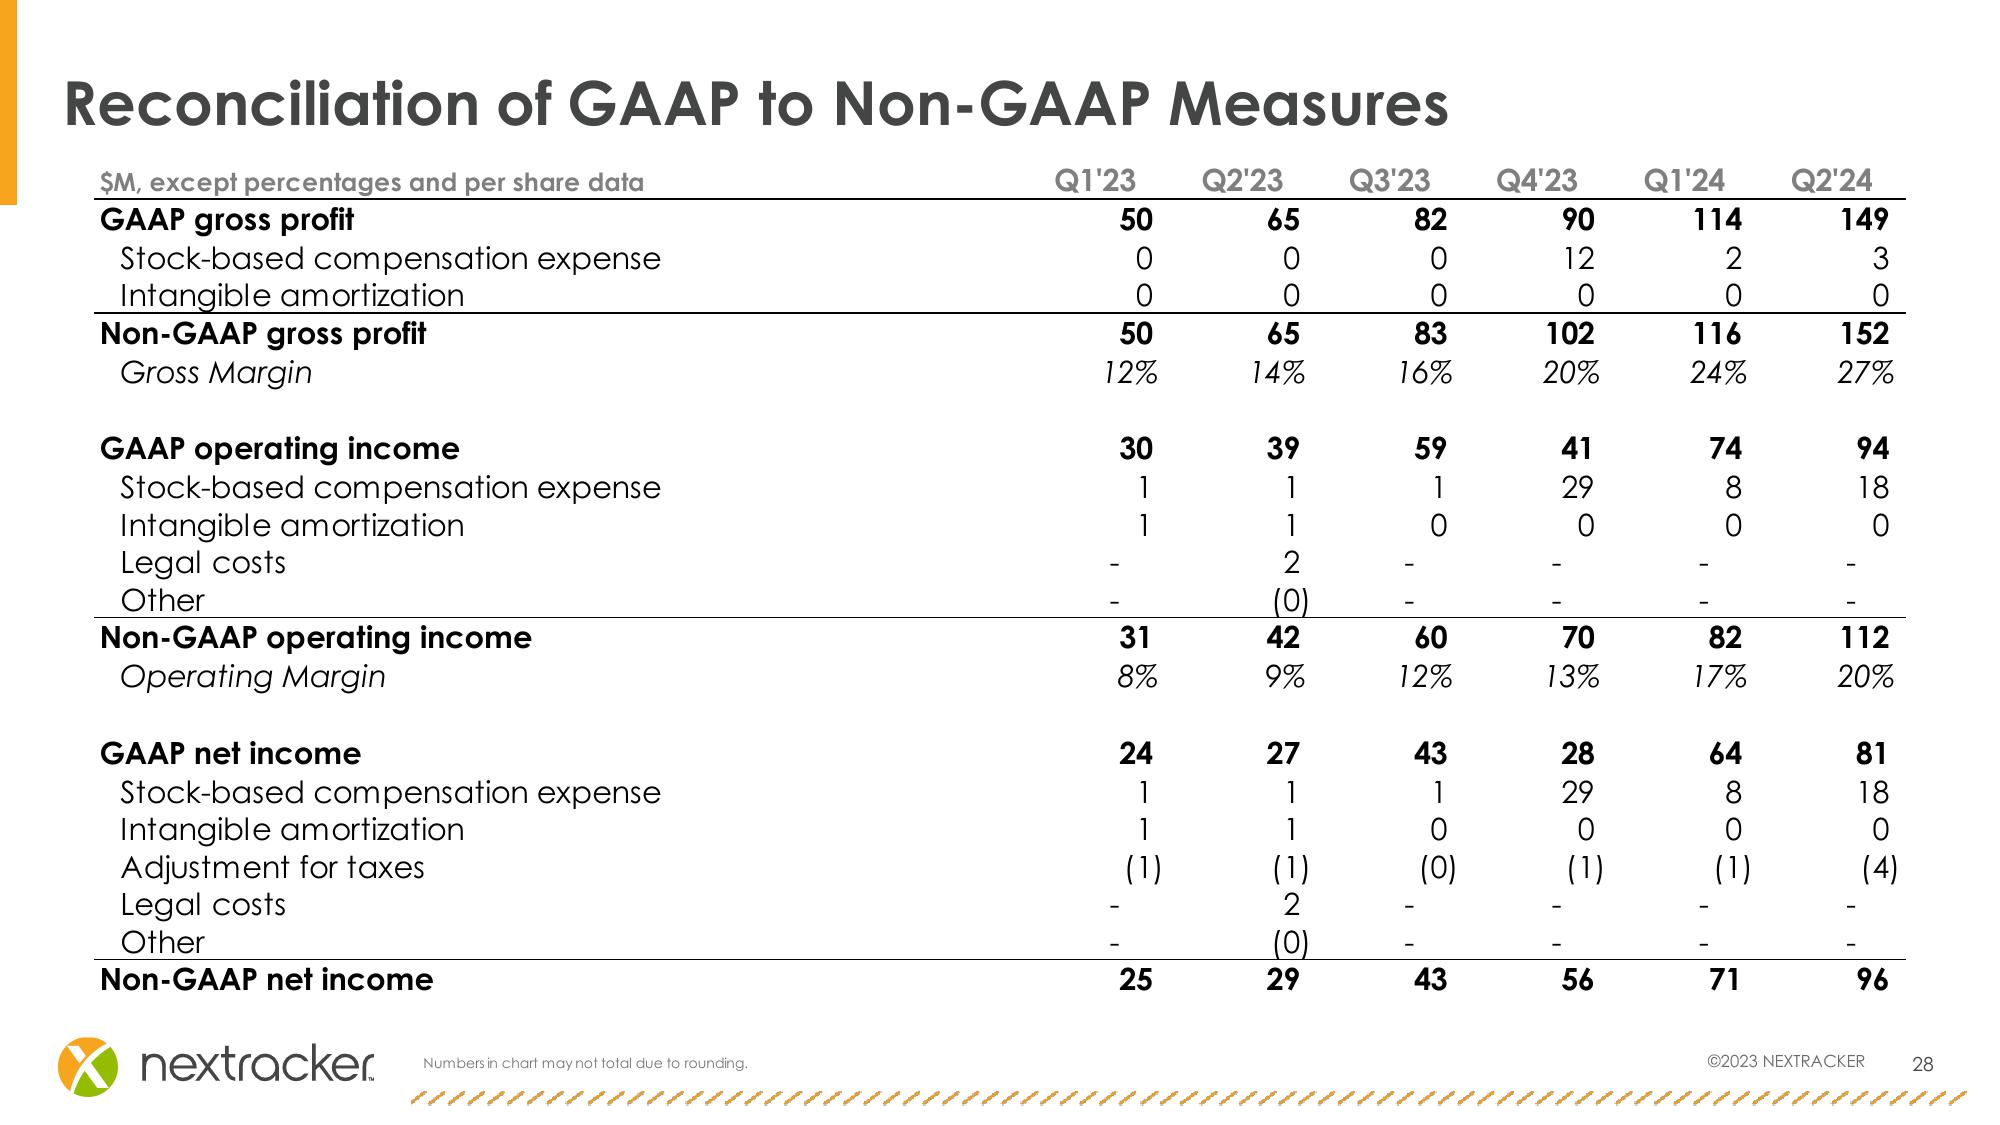
Reconciliation of GAAP to Non-GAAP Measures
$M, except percentages and per share data
Q1'23
Q2'23
Q3'23
Q4'23
Q1'24
Q2'24
GAAP gross profit
50
65
82
90
114
149
Stock-based compensation expense
Intangible amortization
0
0
0
12
2
3
0
0
0
0
0
Non-GAAP gross profit
50
65
83
102
116
152
Gross Margin
12%
14%
16%
20%
24%
27%
GAAP operating income
Stock-based compensation expense
Intangible amortization
3--
30
39
59
1
1
1
1
0
1120
41
74
94
29
8
18
2800
Legal costs
2
Other
(0)
Non-GAAP operating income
31
42
60
70
82
112
Operating Margin
8%
9%
12%
13%
17%
20%
GAAP net income
24
27
43
28
64
81
Stock-based compensation expense
1
1
29
8
18
Intangible amortization
1
1
0
0
Adjustment for taxes
(1)
(1)
(0)
(1)
(1)
0円
(4)
Legal costs
2
Other
(0)
|
Non-GAAP net income
25
29
43
56
71
96
nextracker.
Numbers in chart may not total due to rounding.
©2023 NEXTRACKER
28View entire presentation