Apollo Global Management Investor Day Presentation Deck
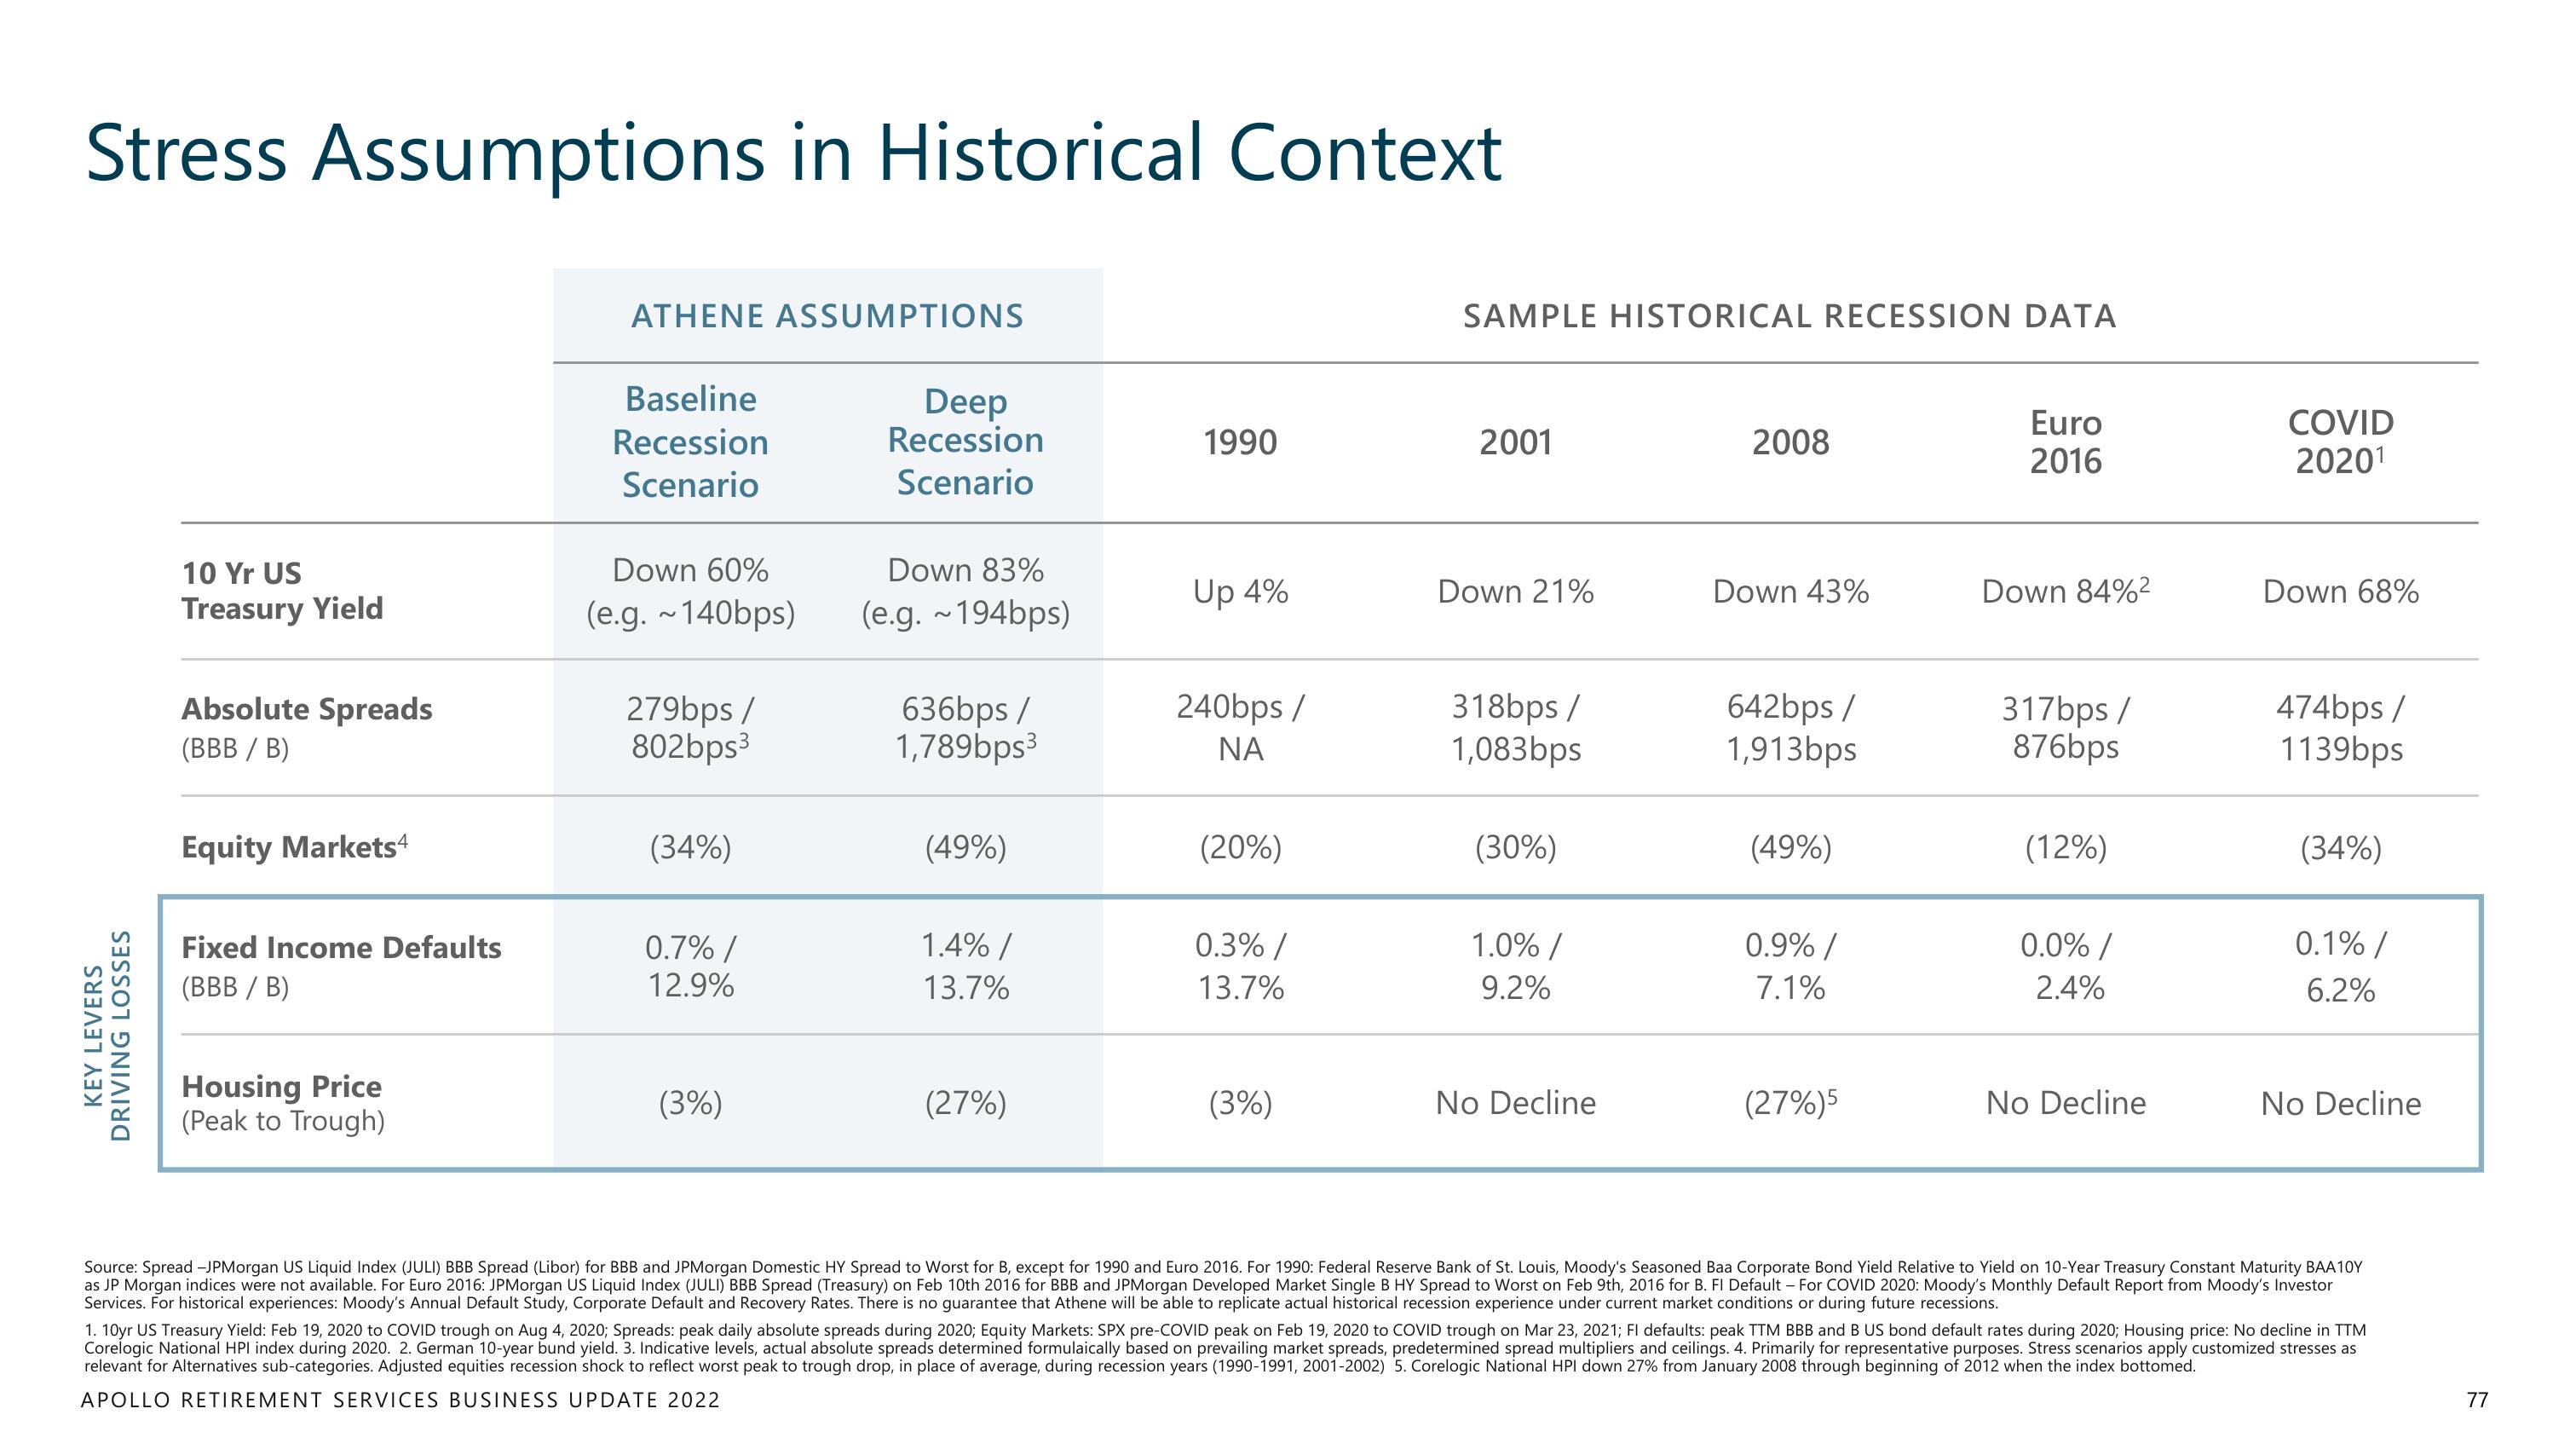
Stress Assumptions in Historical Context
KEY LEVERS
DRIVING LOSSES
10 Yr US
Treasury Yield
Absolute Spreads
(BBB / B)
Equity Markets4
Fixed Income Defaults
(BBB / B)
Housing Price
(Peak to Trough)
ATHENE ASSUMPTIONS
Baseline
Recession
Scenario
Down 60%
(e.g. ~140bps)
279bps /
802bps³
(34%)
0.7% /
12.9%
(3%)
Deep
Recession
Scenario
Down 83%
(e.g. ~194bps)
636bps /
1,789bps³
(49%)
1.4% /
13.7%
(27%)
1990
Up 4%
240bps /
ΝΑ
(20%)
0.3% /
13.7%
(3%)
SAMPLE HISTORICAL RECESSION DATA
2001
Down 21%
318bps /
1,083bps
(30%)
1.0% /
9.2%
No Decline
2008
Down 43%
642bps /
1,913bps
(49%)
0.9% /
7.1%
(27%)5
Euro
2016
Down 84%²
317bps /
876bps
(12%)
0.0% /
2.4%
No Decline
COVID
2020¹
Down 68%
474bps /
1139bps
(34%)
0.1% /
6.2%
No Decline
Source: Spread -JPMorgan US Liquid Index (JULI) BBB Spread (Libor) for BBB and JPMorgan Domestic HY Spread to Worst for B, except for 1990 and Euro 2016. For 1990: Federal Reserve Bank of St. Louis, Moody's Seasoned Baa Corporate Bond Yield Relative to Yield on 10-Year Treasury Constant Maturity BAA10Y
as JP Morgan indices were not available. For Euro 2016: JPMorgan US Liquid Index (JULI) BBB Spread (Treasury) on Feb 10th 2016 for BBB and JPMorgan Developed Market Single B HY Spread to Worst on Feb 9th, 2016 for B. FI Default - For COVID 2020: Moody's Monthly Default Report from Moody's Investor
Services. For historical experiences: Moody's Annual Default Study, Corporate Default and Recovery Rates. There is no guarantee that Athene will be able to replicate actual historical recession experience under current market conditions or during future recessions.
1. 10yr US Treasury Yield: Feb 19, 2020 to COVID trough on Aug 4, 2020; Spreads: peak daily absolute spreads during 2020; Equity Markets: SPX pre-COVID peak on Feb 19, 2020 to COVID trough on Mar 23, 2021; FI defaults: peak TTM BBB and B US bond default rates during 2020; Housing price: No decline in TTM
Corelogic National HPI index during 2020. 2. German 10-year bund yield. 3. Indicative levels, actual absolute spreads determined formulaically based on prevailing market spreads, predetermined spread multipliers and ceilings. 4. Primarily for representative purposes. Stress scenarios apply customized stresses as
relevant for Alternatives sub-categories. Adjusted equities recession shock to reflect worst peak to trough drop, in place of average, during recession years (1990-1991, 2001-2002) 5. Corelogic National HPI down 27% from January 2008 through beginning of 2012 when the index bottomed.
APOLLO RETIREMENT SERVICES BUSINESS UPDATE 2022
77View entire presentation