J.P. Morgan 2016 Auto Conference
Historical Financial Performance
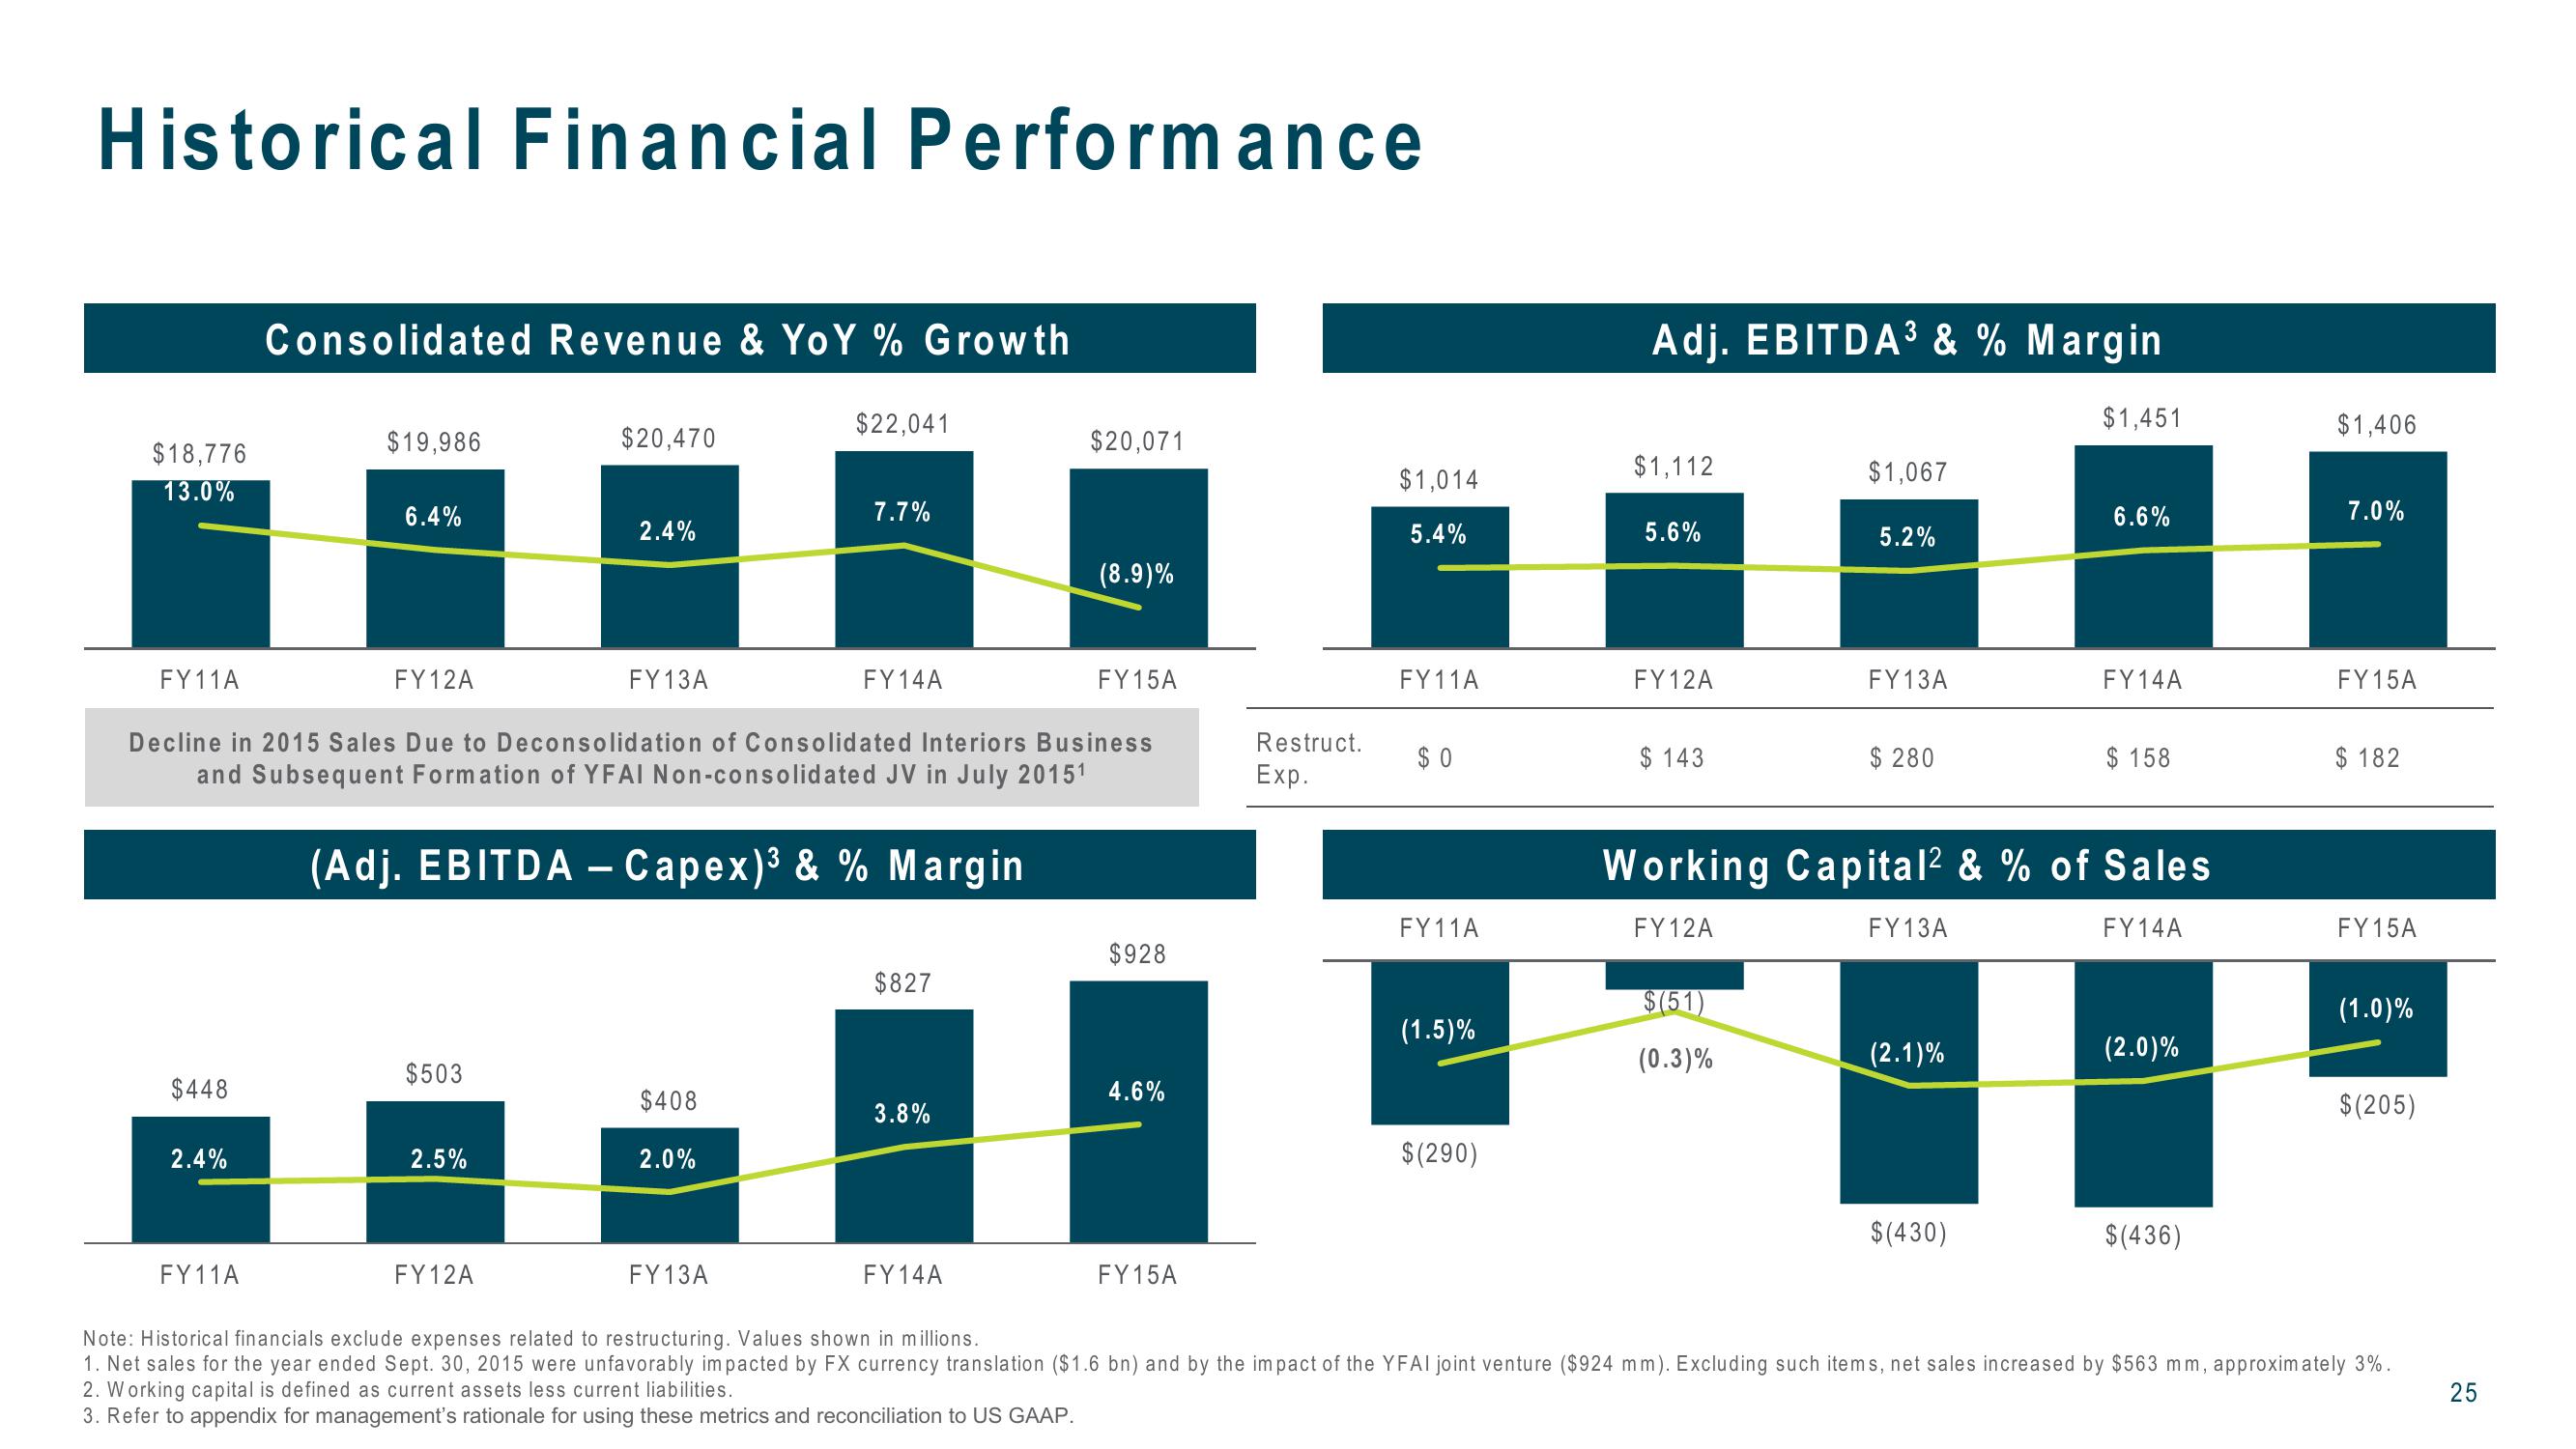
Consolidated Revenue & YoY % Growth
Adj. EBITDA³ & % Margin
$1,451
$1,406
$22,041
$19,986
$20,470
$20,071
$18,776
13.0%
$1,112
$1,067
$1,014
7.7%
6.6%
7.0%
6.4%
2.4%
5.4%
5.6%
5.2%
(8.9)%
FY11A
FY12A
FY13A
FY14A
FY15A
Decline in 2015 Sales Due to Deconsolidation of Consolidated Interiors Business
and Subsequent Formation of YFAI Non-consolidated JV in July 20151
FY11A
FY12A
FY13A
FY14A
FY15A
Restruct.
Exp.
$ 0
$ 143
$ 280
$ 158
$ 182
(Adj. EBITDA - Capex)³ & % Margin
Working Capital² & % of Sales
FY11A
FY12A
FY13A
FY14A
FY15A
$928
$827
$(51)
(1.0)%
(1.5)%
(0.3)%
(2.1)%
(2.0)%
$503
$448
4.6%
$408
$(205)
3.8%
2.4%
2.5%
2.0%
$(290)
FY11A
FY12A
FY13A
FY14A
FY15A
$(430)
$(436)
Note: Historical financials exclude expenses related to restructuring. Values shown in millions.
1. Net sales for the year ended Sept. 30, 2015 were unfavorably impacted by FX currency translation ($1.6 bn) and by the impact of the YFAI joint venture ($924 mm). Excluding such items, net sales increased by $563 mm, approximately 3%.
2. Working capital is defined as current assets less current liabilities.
3. Refer to appendix for management's rationale for using these metrics and reconciliation to US GAAP.
25View entire presentation