SmileDirectClub Investor Presentation Deck
Balance sheet highlights.
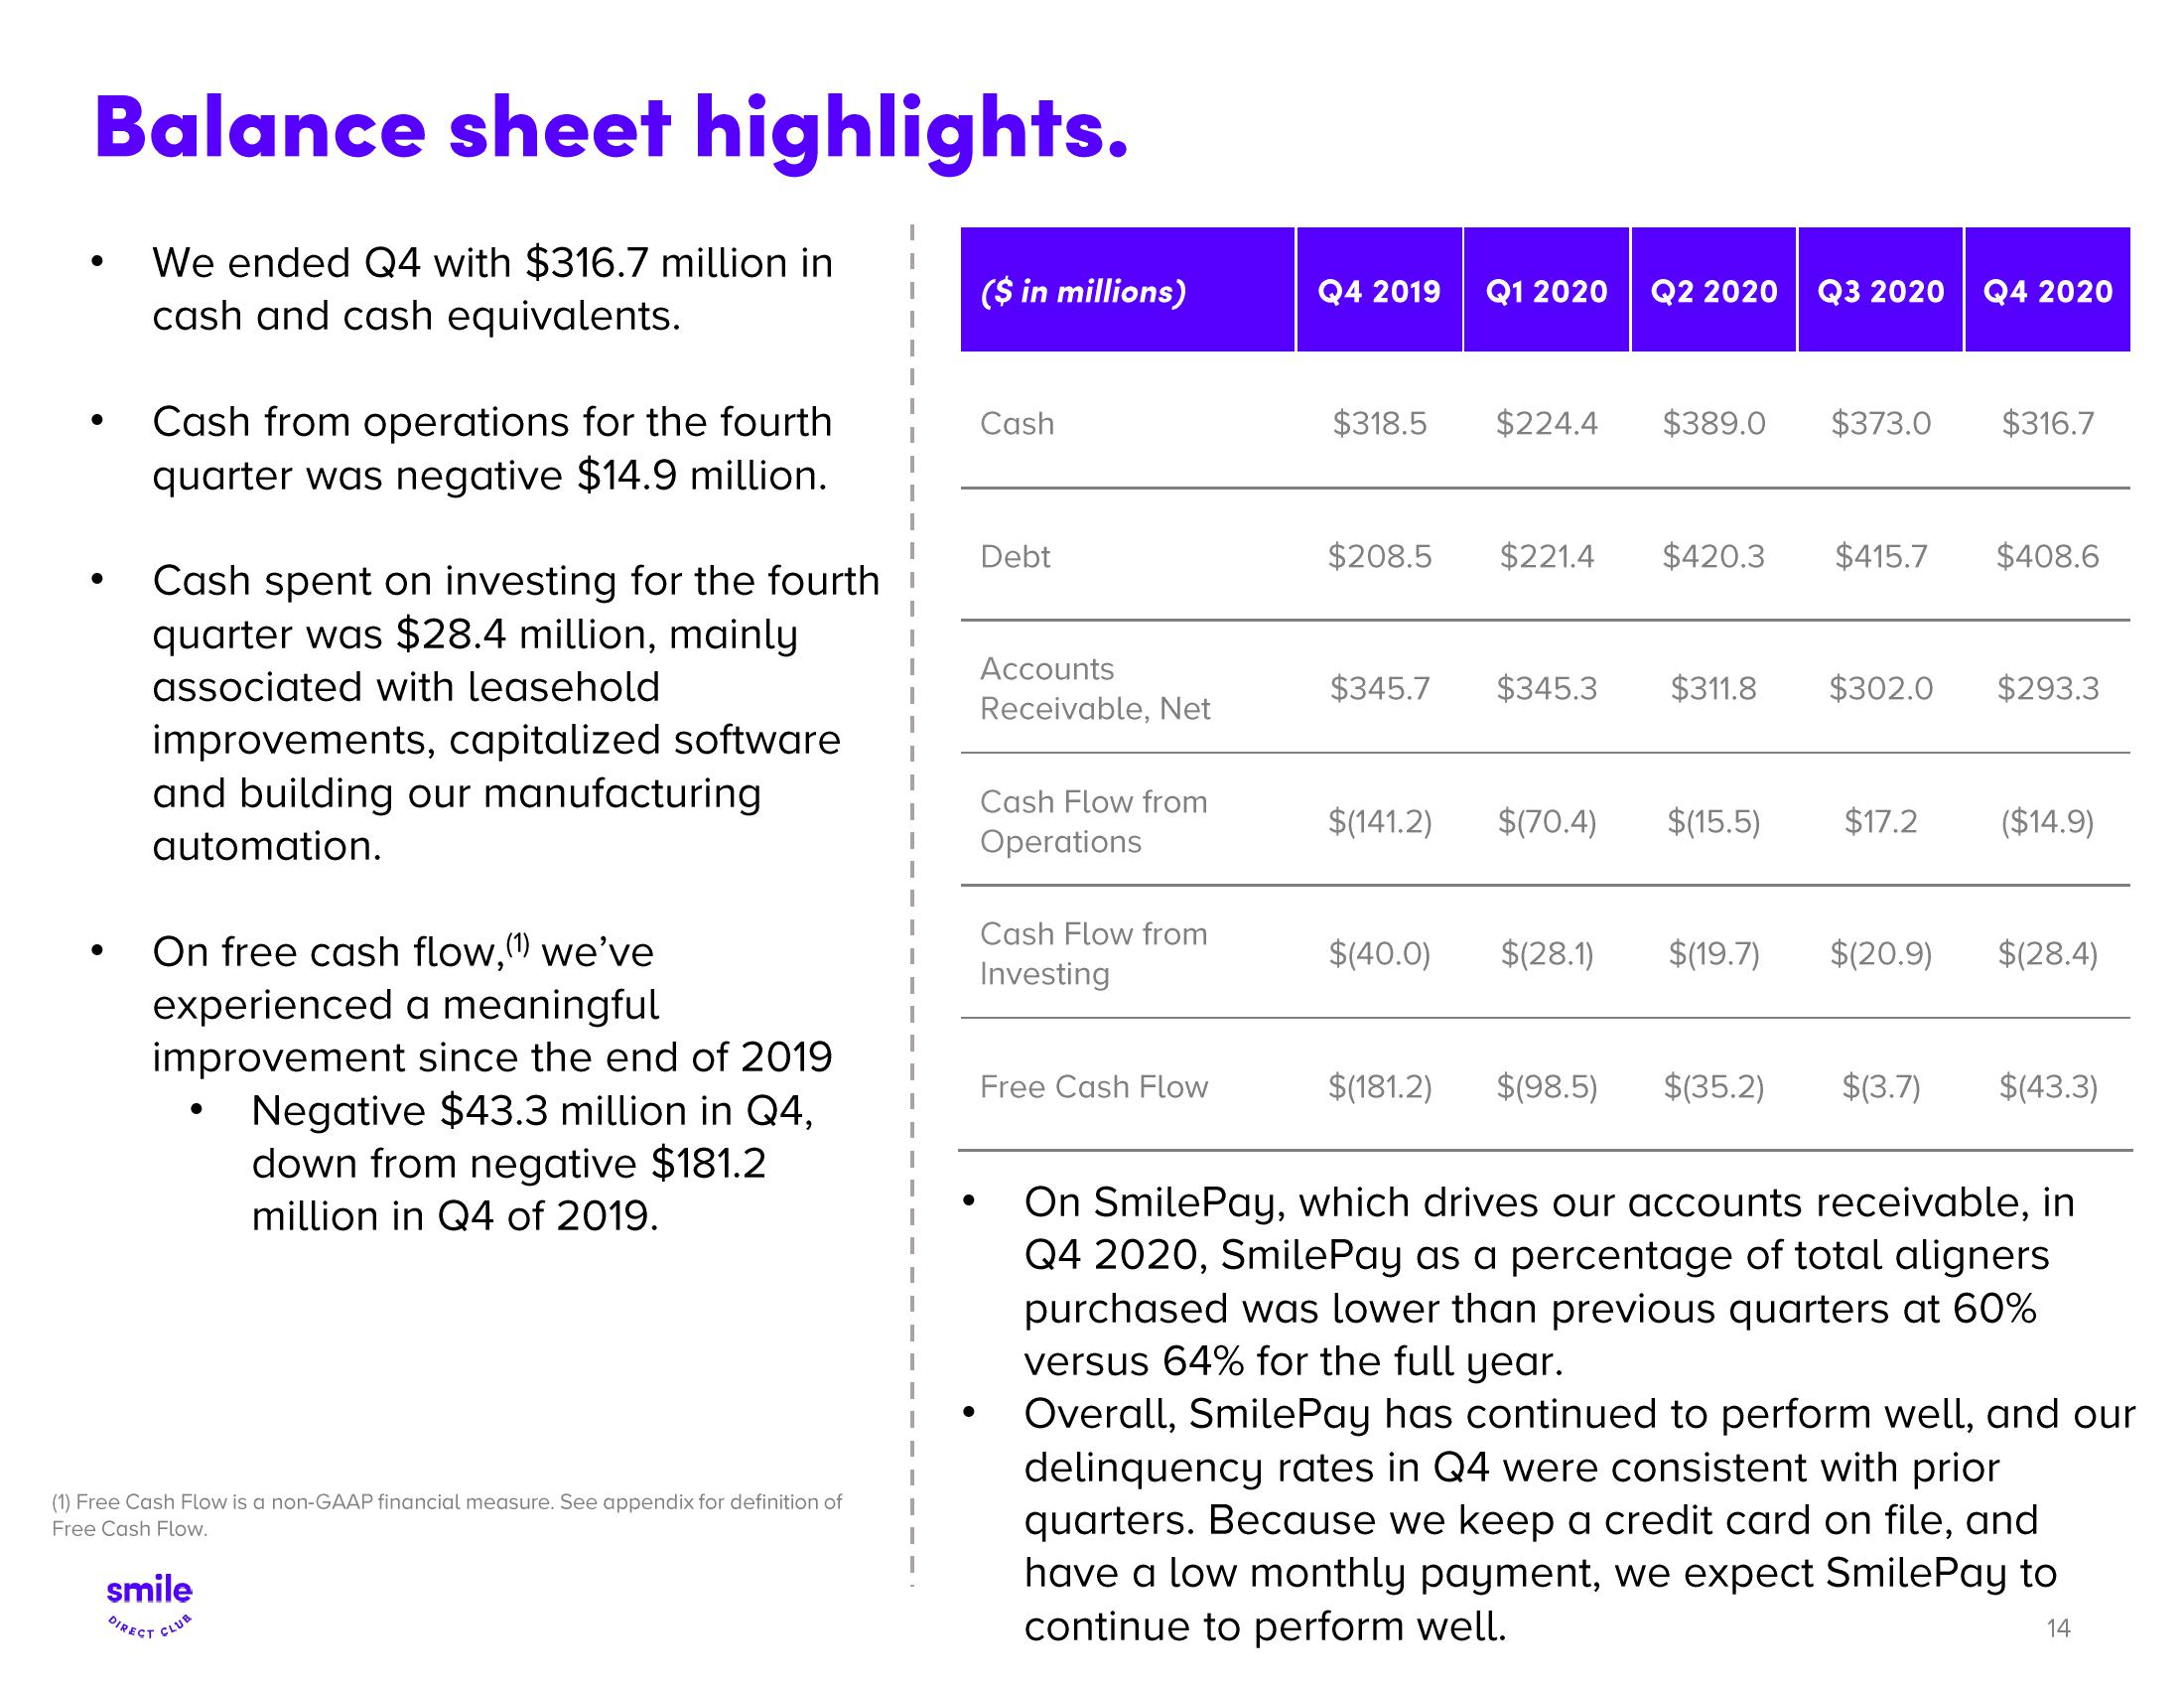
We ended Q4 with $316.7 million in
cash and cash equivalents.
●
Cash from operations for the fourth
quarter was negative $14.9 million.
Cash spent on investing for the fourth
quarter was $28.4 million, mainly
associated with leasehold
improvements, capitalized software
and building our manufacturing
automation.
On free cash flow,(1) we've
experienced a meaningful
improvement since the end of 2019
Negative $43.3 million in Q4,
down from negative $181.2
million in Q4 of 2019.
(1) Free Cash Flow is a non-GAAP financial measure. See appendix for definition of
Free Cash Flow.
smile
DIRECT CLUB
($ in millions)
Cash
Debt
Accounts
Receivable, Net
Cash Flow from
Operations
Cash Flow from
Investing
Free Cash Flow
Q4 2019
$318.5
$208.5
Q1 2020
$224.4
Q2 2020 Q3 2020 Q4 2020
$389.0
$(141.2) $(70.4)
$221.4 $420.3 $415.7
$373.0
$(15.5)
$345.7 $345.3 $311.8 $302.0 $293.3
$17.2
$316.7
$(40.0) $(28.1) $(19.7) $(20.9)
$408.6
($14.9)
$(28.4)
$(181.2) $(98.5) $(35.2) $(3.7) $(43.3)
On SmilePay, which drives our accounts receivable, in
Q4 2020, SmilePay as a percentage of total aligners
purchased was lower than previous quarters at 60%
versus 64% for the full year.
Overall, SmilePay has continued to perform well, and our
delinquency rates in Q4 were consistent with prior
quarters. Because we keep a credit card on file, and
have a low monthly payment, we expect SmilePay to
continue to perform well.
14View entire presentation