WeWork Investor Day Presentation Deck
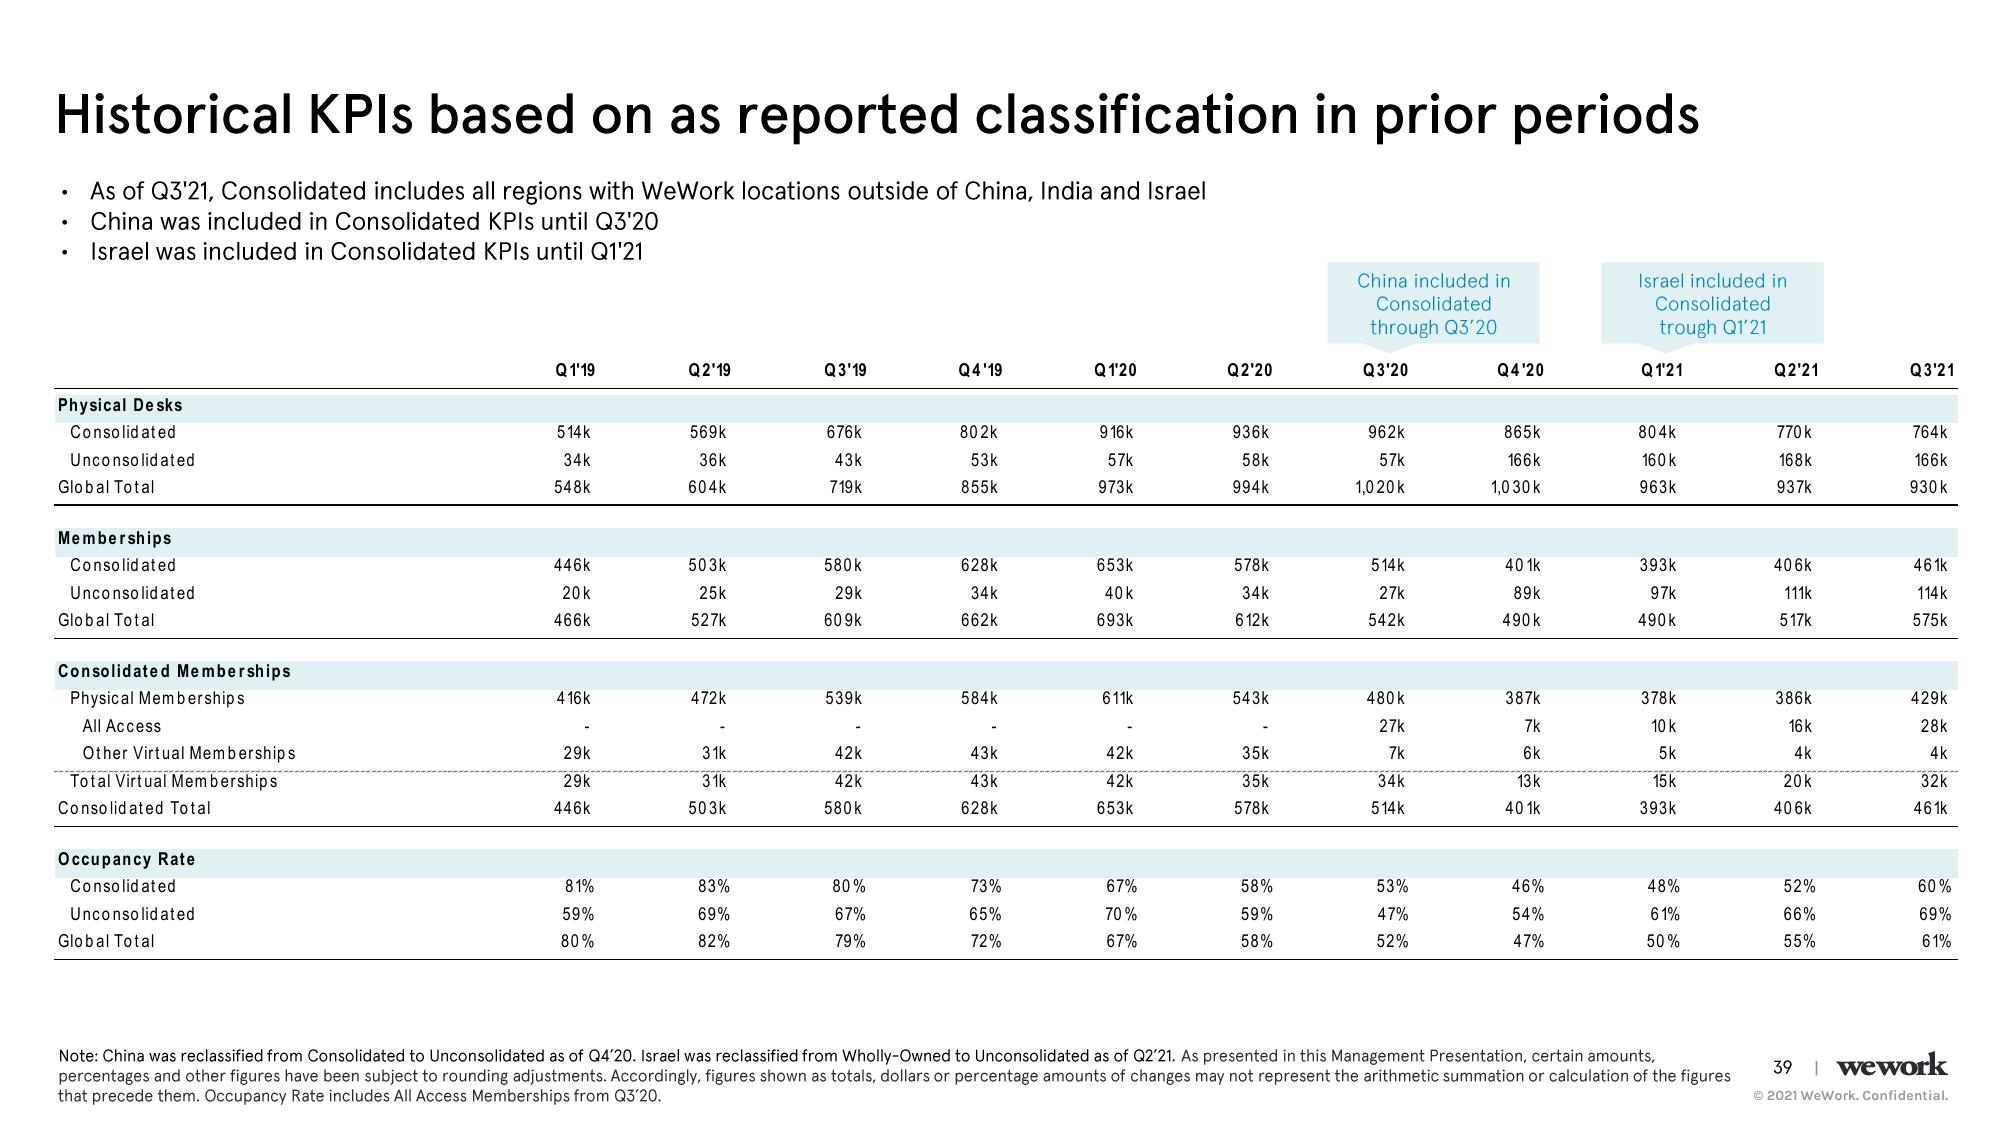
Historical KPIs based on as reported classification in prior periods
As of Q3'21, Consolidated includes all regions with WeWork locations outside of China, India and Israel
China was included in Consolidated KPIs until Q3'20
Israel was included in Consolidated KPIs until Q1'21
Physical Desks
Consolidated
Unconsolidated
Global Total
Memberships
Consolidated
Unconsolidated
Global Total
Consolidated Memberships
Physical Memberships
All Access
Other Virtual Memberships
Total Virtual Memberships
Consolidated Total
Occupancy Rate
Consolidated
Unconsolidated
Global Total
Q1'19
514k
34k
548k
446k
20k
466k
416k
29k
29k
446k
81%
59%
80%
Q2'19
569k
36k
604k
503k
25k
527k
472K
31k
31k
503k
83%
69%
82%
Q3'19
676k
43k
719k
580k
29k
609k
539k
42k
42k
580k
80%
67%
79%
Q4'19
802k
53k
855k
628k
34k
662k
584k
43k
43k
628k
73%
65%
72%
Q1'20
916k
57k
973k
653k
40 k
693k
611k
42k
42k
653k
67%
70%
67%
Q2'20
936k
58k
994k
578k
34k
612k
543k
35k
35k
578k
58%
59%
58%
China included in
Consolidated
through Q3'20
Q3'20
962k
57k
1.0 20 k
514k
27k
542k
480k
27k
7k
34k
514k
53%
47%
52%
Q4'20
865k
166k
1,030 k
401k
89k
490 k
387k
7k
6k
13k
401k
46%
54%
47%
Israel included in
Consolidated
trough Q1'21
Q1'21
804k
160 k
963k
393k
97k
490k
378k
10 k
5k
15k
393k
48%
61%
50%
Note: China was reclassified from Consolidated to Unconsolidated as of Q4'20. Israel was reclassified from Wholly-Owned to Unconsolidated as of Q2'21. As presented in this Management Presentation, certain amounts,
percentages and other figures have been subject to rounding adjustments. Accordingly, figures shown as totals, dollars or percentage amounts of changes may not represent the arithmetic summation or calculation of the figures
that precede them. Occupancy Rate includes All Access Memberships from Q3'20.
Q2'21
770k
168k
937k
406k
111k
517k
386k
16 k
4k
20k
406k
52%
66%
55%
Q3'21
764k
166k
930k
461k
114k
575k
429k
28k
4k
32k
461k
60%
69%
61%
39 | wework
Ⓒ2021 WeWork. Confidential.View entire presentation