Community Solar Deployment and Subscriptions
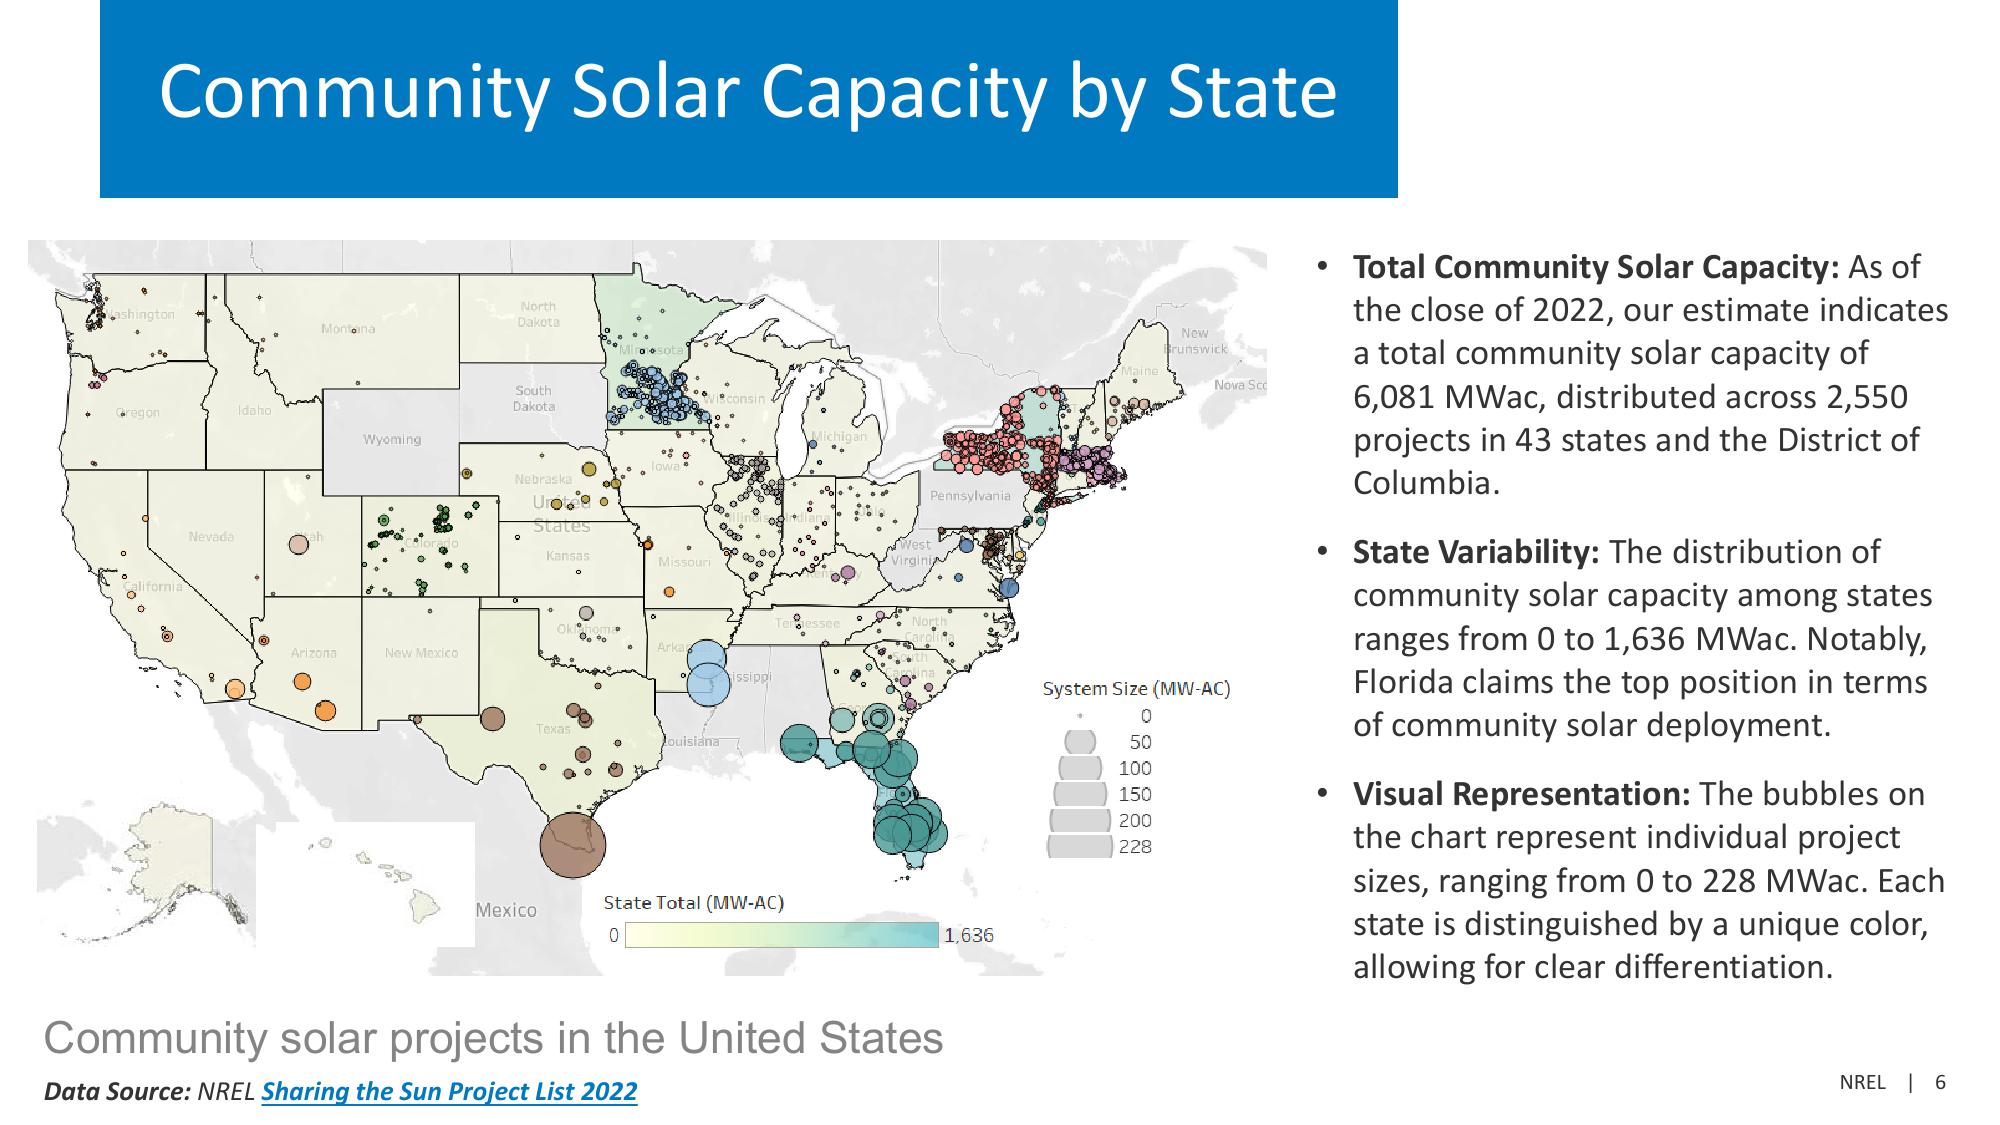
Community Solar Capacity by State
ashington
North
Dakota
Montoina
Gregon
Idaho
Wyoming
California
Nevada
Arizona
New Mexico
°
°
South
Dakota
lowa
Michigan
Nebraska
Urote o
States
Pennsylvania
Kansas
Missouri
West
Virgini
°
Arka
issippi
Texas
Louisiana
State Total (MW-AC)
Mexico
0
1,636
Community solar projects in the United States
Data Source: NREL Sharing the Sun Project List 2022
New
Brunswick
Nova Sco
System Size (MW-AC)
0
50
100
150
200
228
Total Community Solar Capacity: As of
the close of 2022, our estimate indicates
a total community solar capacity of
6,081 MWac, distributed across 2,550
projects in 43 states and the District of
Columbia.
⚫ State Variability: The distribution of
community solar capacity among states
ranges from 0 to 1,636 MWac. Notably,
Florida claims the top position in terms
of community solar deployment.
Visual Representation: The bubbles on
the chart represent individual project
sizes, ranging from 0 to 228 MWac. Each
state is distinguished by a unique color,
allowing for clear differentiation.
NREL 6View entire presentation