Uber Results Presentation Deck
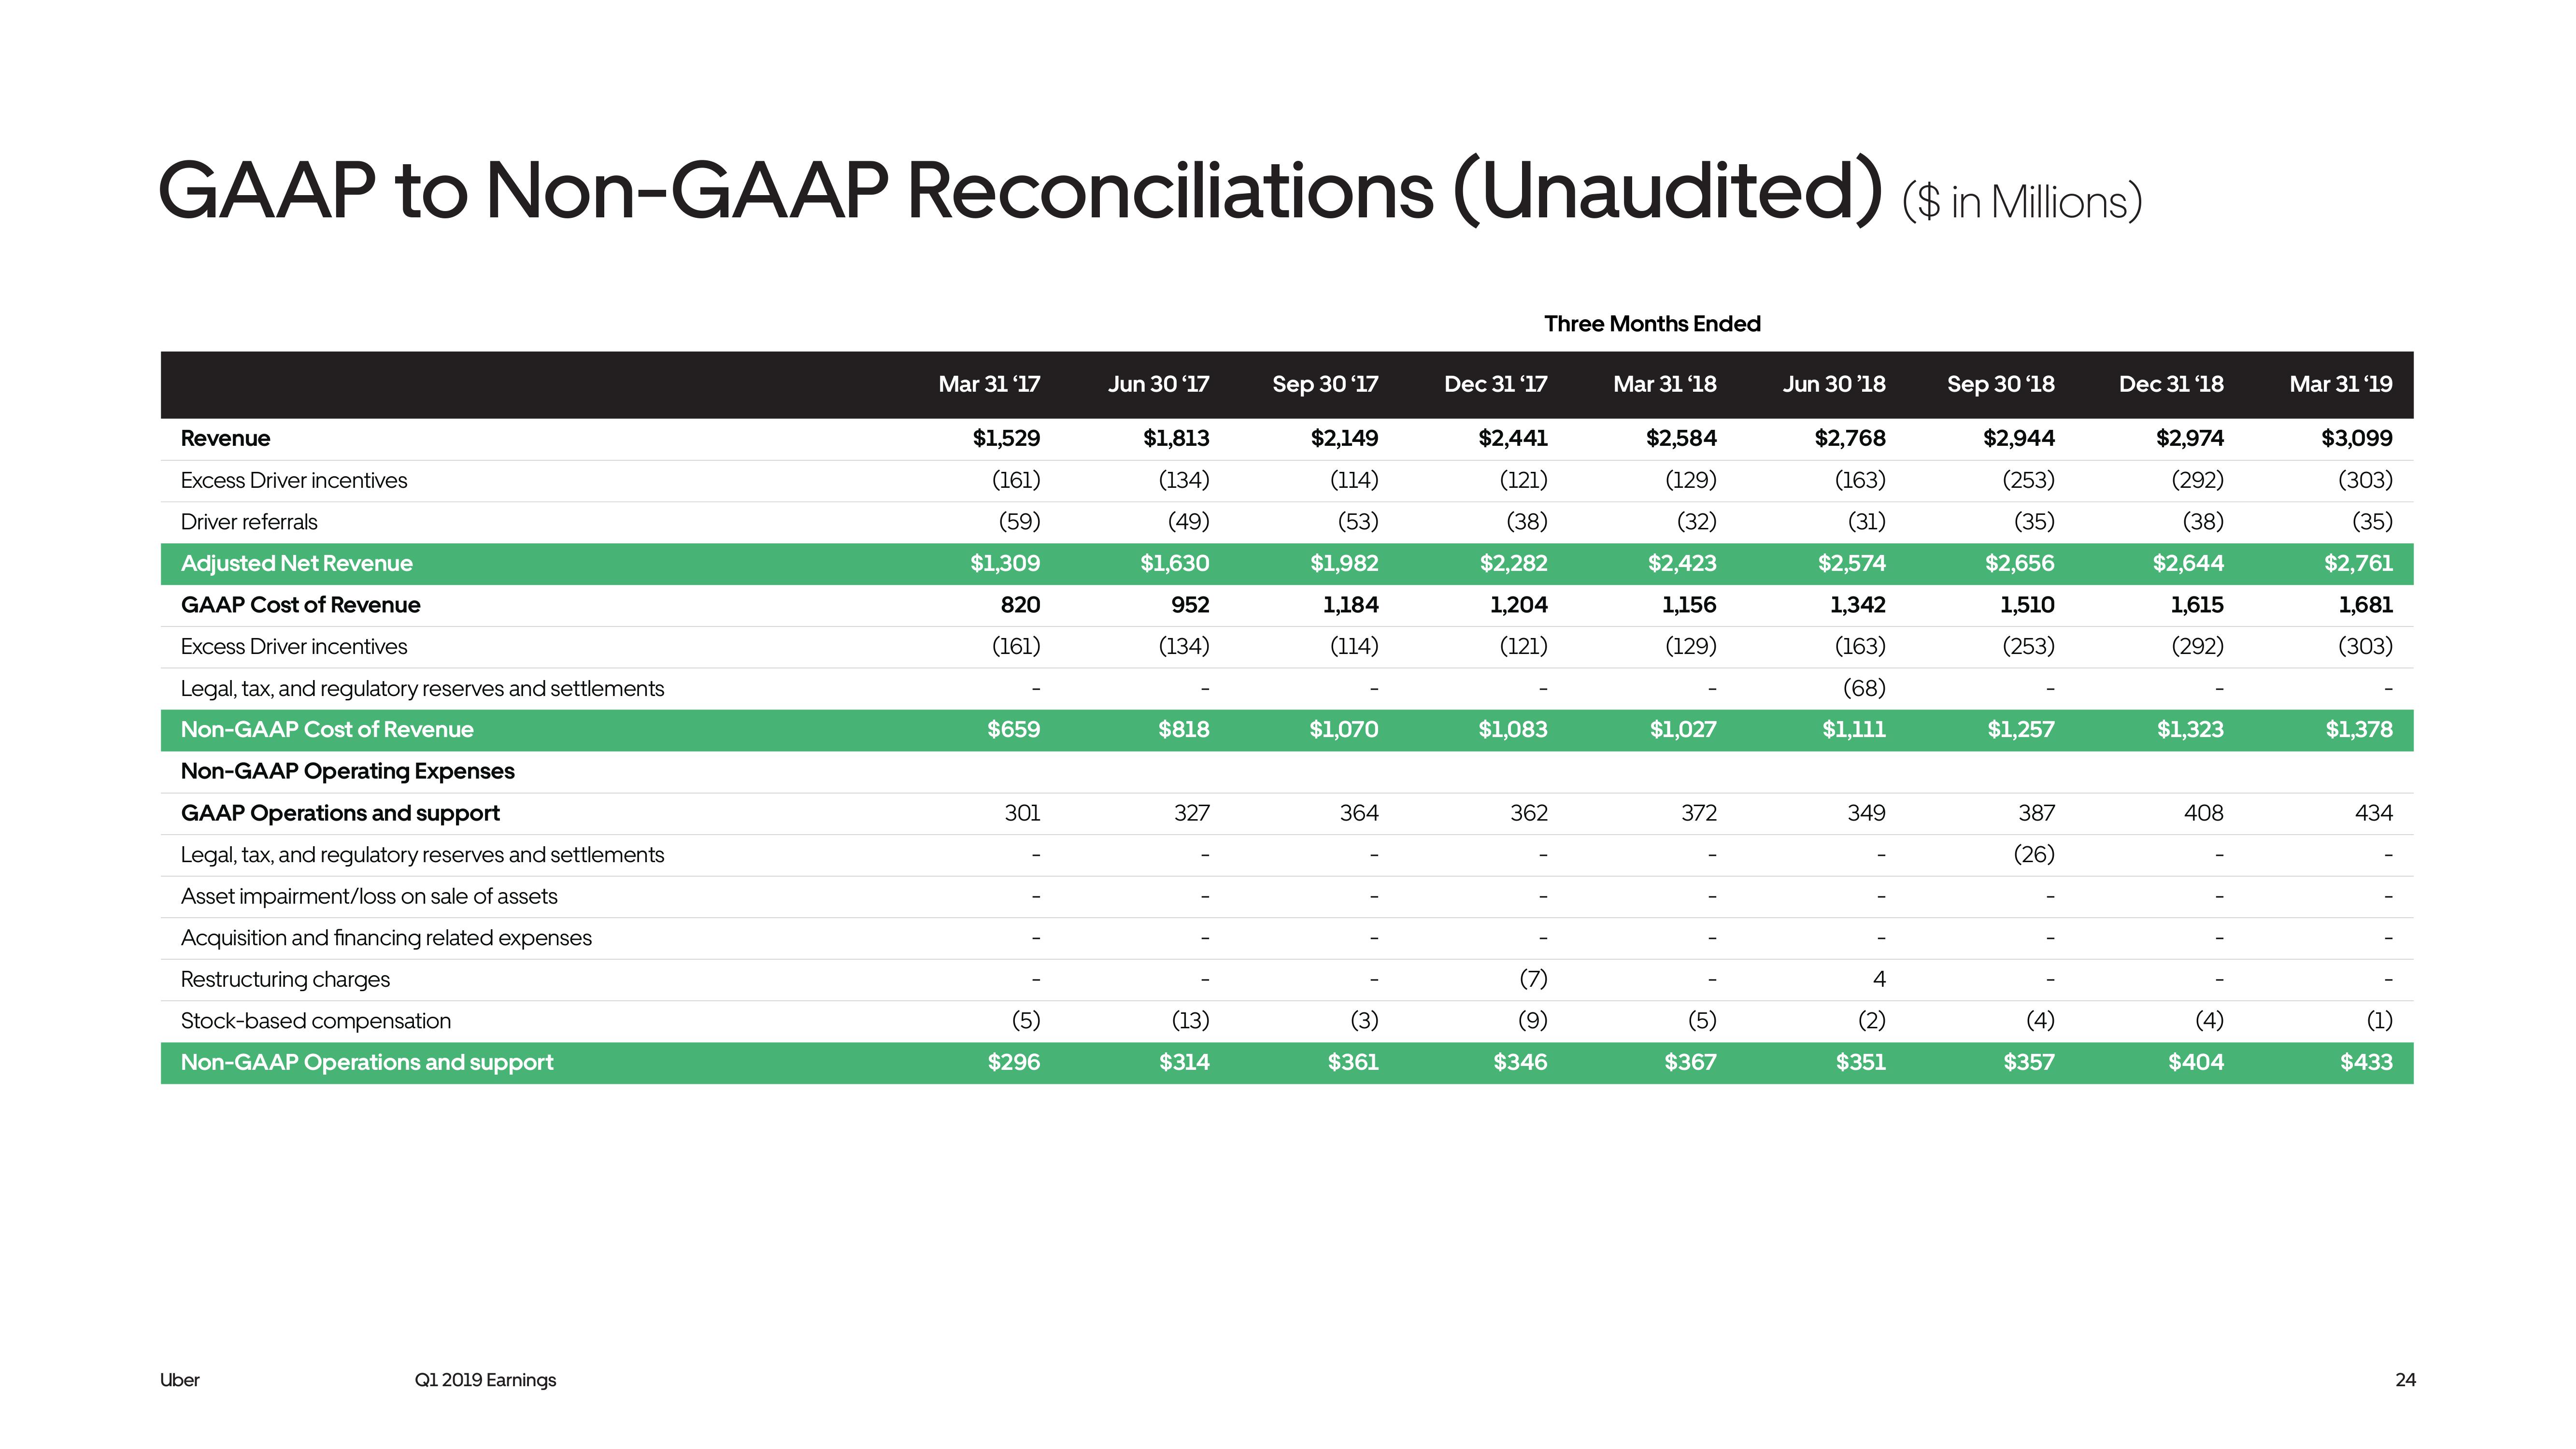
GAAP to Non-GAAP Reconciliations (Unaudited) ($ in Millions)
Revenue
Excess Driver incentives
Driver referrals
Adjusted Net Revenue
GAAP Cost of Revenue
Excess Driver incentives
Legal, tax, and regulatory reserves and settlements
Non-GAAP Cost of Revenue
Non-GAAP Operating Expenses
GAAP Operations and support
Legal, tax, and regulatory reserves and settlements
Asset impairment/loss on sale of assets
Acquisition and financing related expenses
Restructuring charges
Stock-based compensation
Non-GAAP Operations and support
Uber
Q1 2019 Earnings
Mar 31 '17
$1,529
(161)
(59)
$1,309
820
(161)
$659
301
(5)
$296
Jun 30 '17
$1,813
(134)
(49)
$1,630
952
(134)
$818
327
(13)
$314
Sep 30 '17
$2,149
(114)
(53)
$1,982
1,184
(114)
$1,070
364
(3)
$361
Three Months Ended
Dec 31 '17
$2,441
(121)
(38)
$2,282
1,204
(121)
$1,083
362
(7)
(9)
$346
Mar 31 '18
$2,584
(129)
(32)
$2,423
1,156
(129)
$1,027
372
(5)
$367
Jun 30'18
$2,768
(163)
(31)
$2,574
1,342
(163)
(68)
$1,111
349
4
(2)
$351
Sep 30'18
$2,944
(253)
(35)
$2,656
1,510
(253)
$1,257
387
(26)
(4)
$357
Dec 31 '18
$2,974
(292)
(38)
$2,644
1,615
(292)
$1,323
408
(4)
$404
Mar 31 '19
$3,099
(303)
(35)
$2,761
1,681
(303)
$1,378
434
(1)
$433
24View entire presentation