jetBlue Results Presentation Deck
Operating expense, operating
income (loss), adjusted operating
margin, pre-tax income (loss),
adjusted pre-tax margin, net
income (loss) and earnings (loss)
per share, excluding special
items and gain (loss) on equity
investments
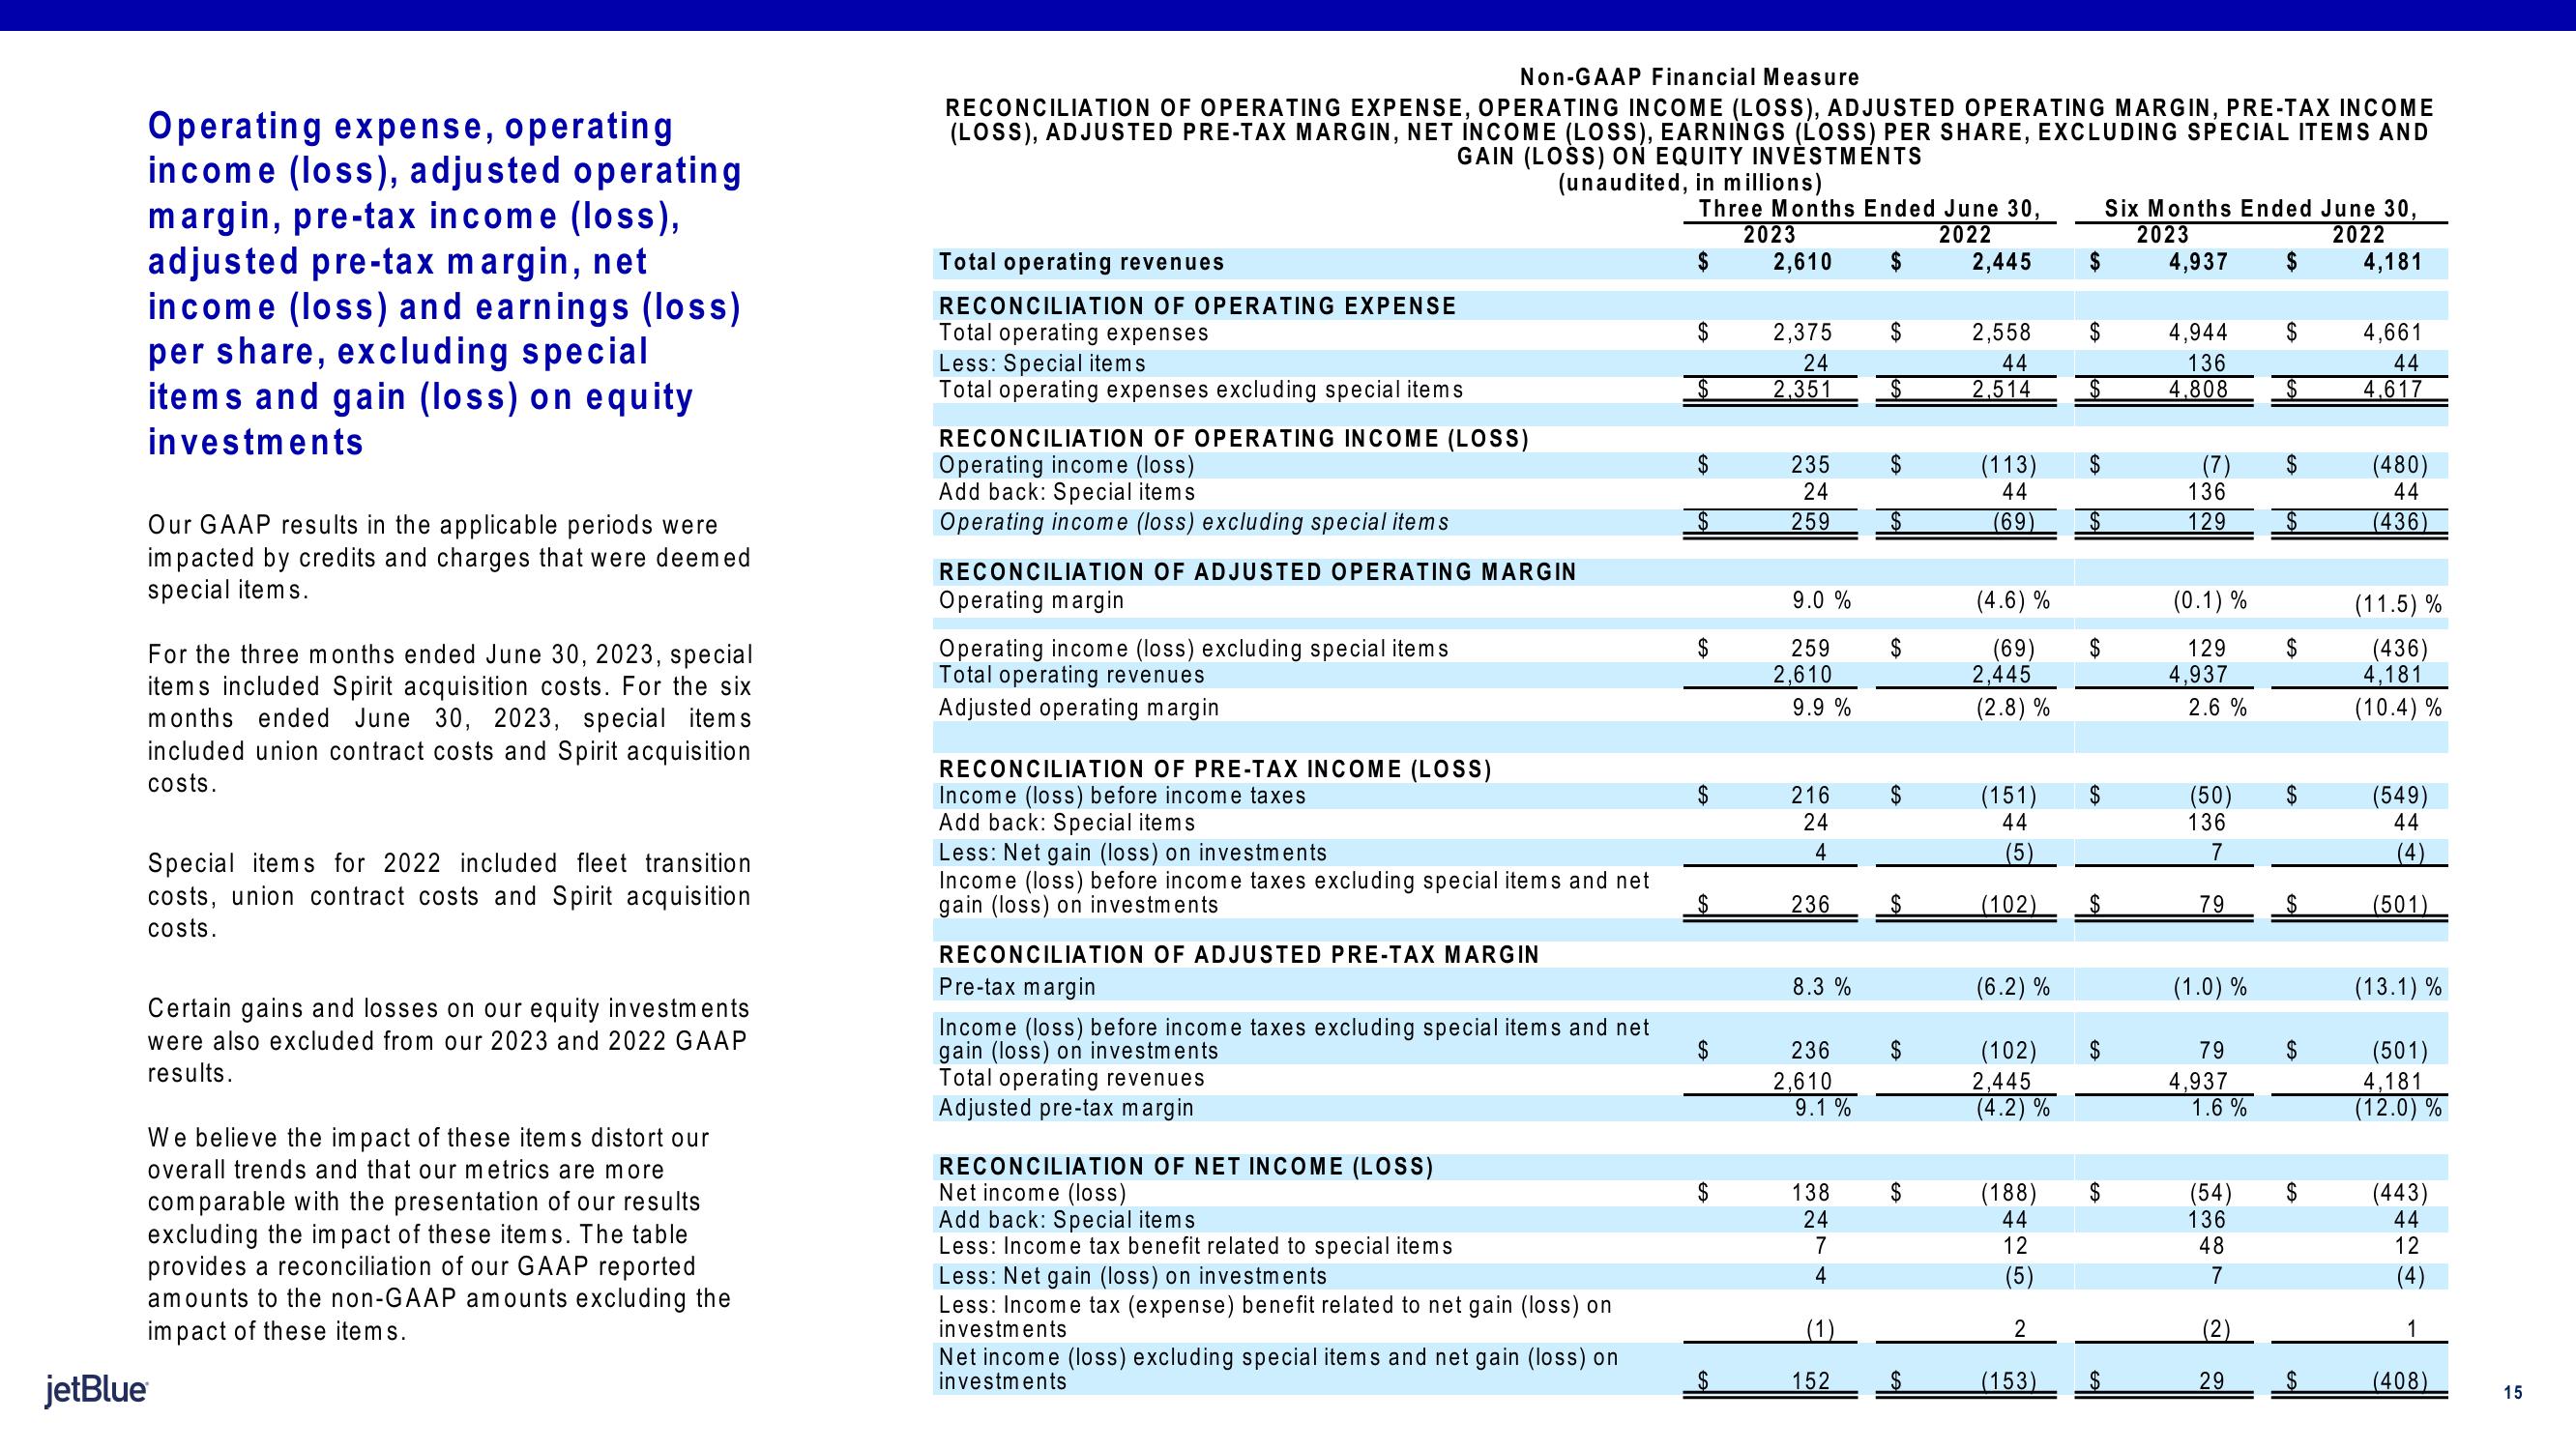
Our GAAP results in the applicable periods were
impacted by credits and charges that were deemed
special items.
For the three months ended June 30, 2023, special
items included Spirit acquisition costs. For the six
months ended June 30, 2023, special items
included union contract costs and Spirit acquisition
costs.
Special items for 2022 included fleet transition
costs, union contract costs and Spirit acquisition
costs.
Certain gains and losses on our equity investments
were also excluded from our 2023 and 2022 GAAP
results.
We believe the impact of these items distort our
overall trends and that our metrics are more
comparable with the presentation of our results
excluding the impact of these items. The table
provides a reconciliation of our GAAP reported
amounts to the non-GAAP amounts excluding the
impact of these items.
jetBlue
Non-GAAP Financial Measure
RECONCILIATION OF OPERATING EXPENSE, OPERATING INCOME (LOSS), ADJUSTED OPERATING MARGIN, PRE-TAX INCOME
(LOSS), ADJUSTED PRE-TAX MARGIN, NET INCOME (LOSS), EARNINGS (LOSS) PER SHARE, EXCLUDING SPECIAL ITEMS AND
GAIN (LOSS) ON EQUITY INVESTMENTS
(unaudited, in millions)
Three Months Ended June 30,
2023
2022
2,445
2,610
Total operating revenues
RECONCILIATION OF OPERATING EXPENSE
Total operating expenses
Less: Special items
Total operating expenses excluding special items
RECONCILIATION OF OPERATING INCOME (LOSS)
Operating income (loss)
Add back: Special items
Operating income (loss) excluding special items
RECONCILIATION OF ADJUSTED OPERATING MARGIN
Operating margin
Operating income (loss) excluding special items
Total operating revenues
Adjusted operating margin
RECONCILIATION OF PRE-TAX INCOME (LOSS)
Income (loss) before income taxes
Add back: Special items
Less: Net gain (loss) on investments
Income (loss) before income taxes excluding special items and net
gain (loss) on investments
RECONCILIATION OF ADJUSTED PRE-TAX MARGIN
Pre-tax margin
Income (loss) before income taxes excluding special items and net
gain (loss) on investments
Total operating revenues
Adjusted pre-tax margin
RECONCILIATION OF NET INCOME (LOSS)
Net income (loss)
Add back: Special items
Less: Income tax benefit related to special items
Less: Net gain (loss) on investments
Less: Income tax (expense) benefit related to net gain (loss) on
investments
Net income (loss) excluding special items and net gain (loss) on
investments
$
$
$
$
$
$
$
$
$
$
2,375
24
2,351
235
24
259
9.0 %
259
2,610
9.9 %
216
24
4
236
8.3%
236
2,610
9.1%
138
24
7
4
(1)
152
$
$
$
2,558
44
2,514
(113)
44
(69)
(4.6) %
(69)
2,445
(2.8) %
(151)
44
(5)
(102)
(6.2) %
(102)
2,445
(4.2)%
(188)
44
12
(5)
2
(153)
$
$
$
$
$
$
$
$
Six Months Ended June 30,
2023
2022
4,937 $ 4,181
4,944
136
4.808
(7)
136
129
(0.1) %
129
4,937
2.6 %
(50)
136
7
79
(1.0) %
79
4,937
1.6%
(54)
136
48
7
29
$
$
$
$
$
$
$
$
4,661
44
4.617
(480)
44
(436)
(11.5) %
(436)
4,181
(10.4) %
(549)
44
(4)
(501)
(13.1) %
(501)
4,181
(12.0) %
(443)
44
12
(4)
(408)
15View entire presentation