Aptiv Overview
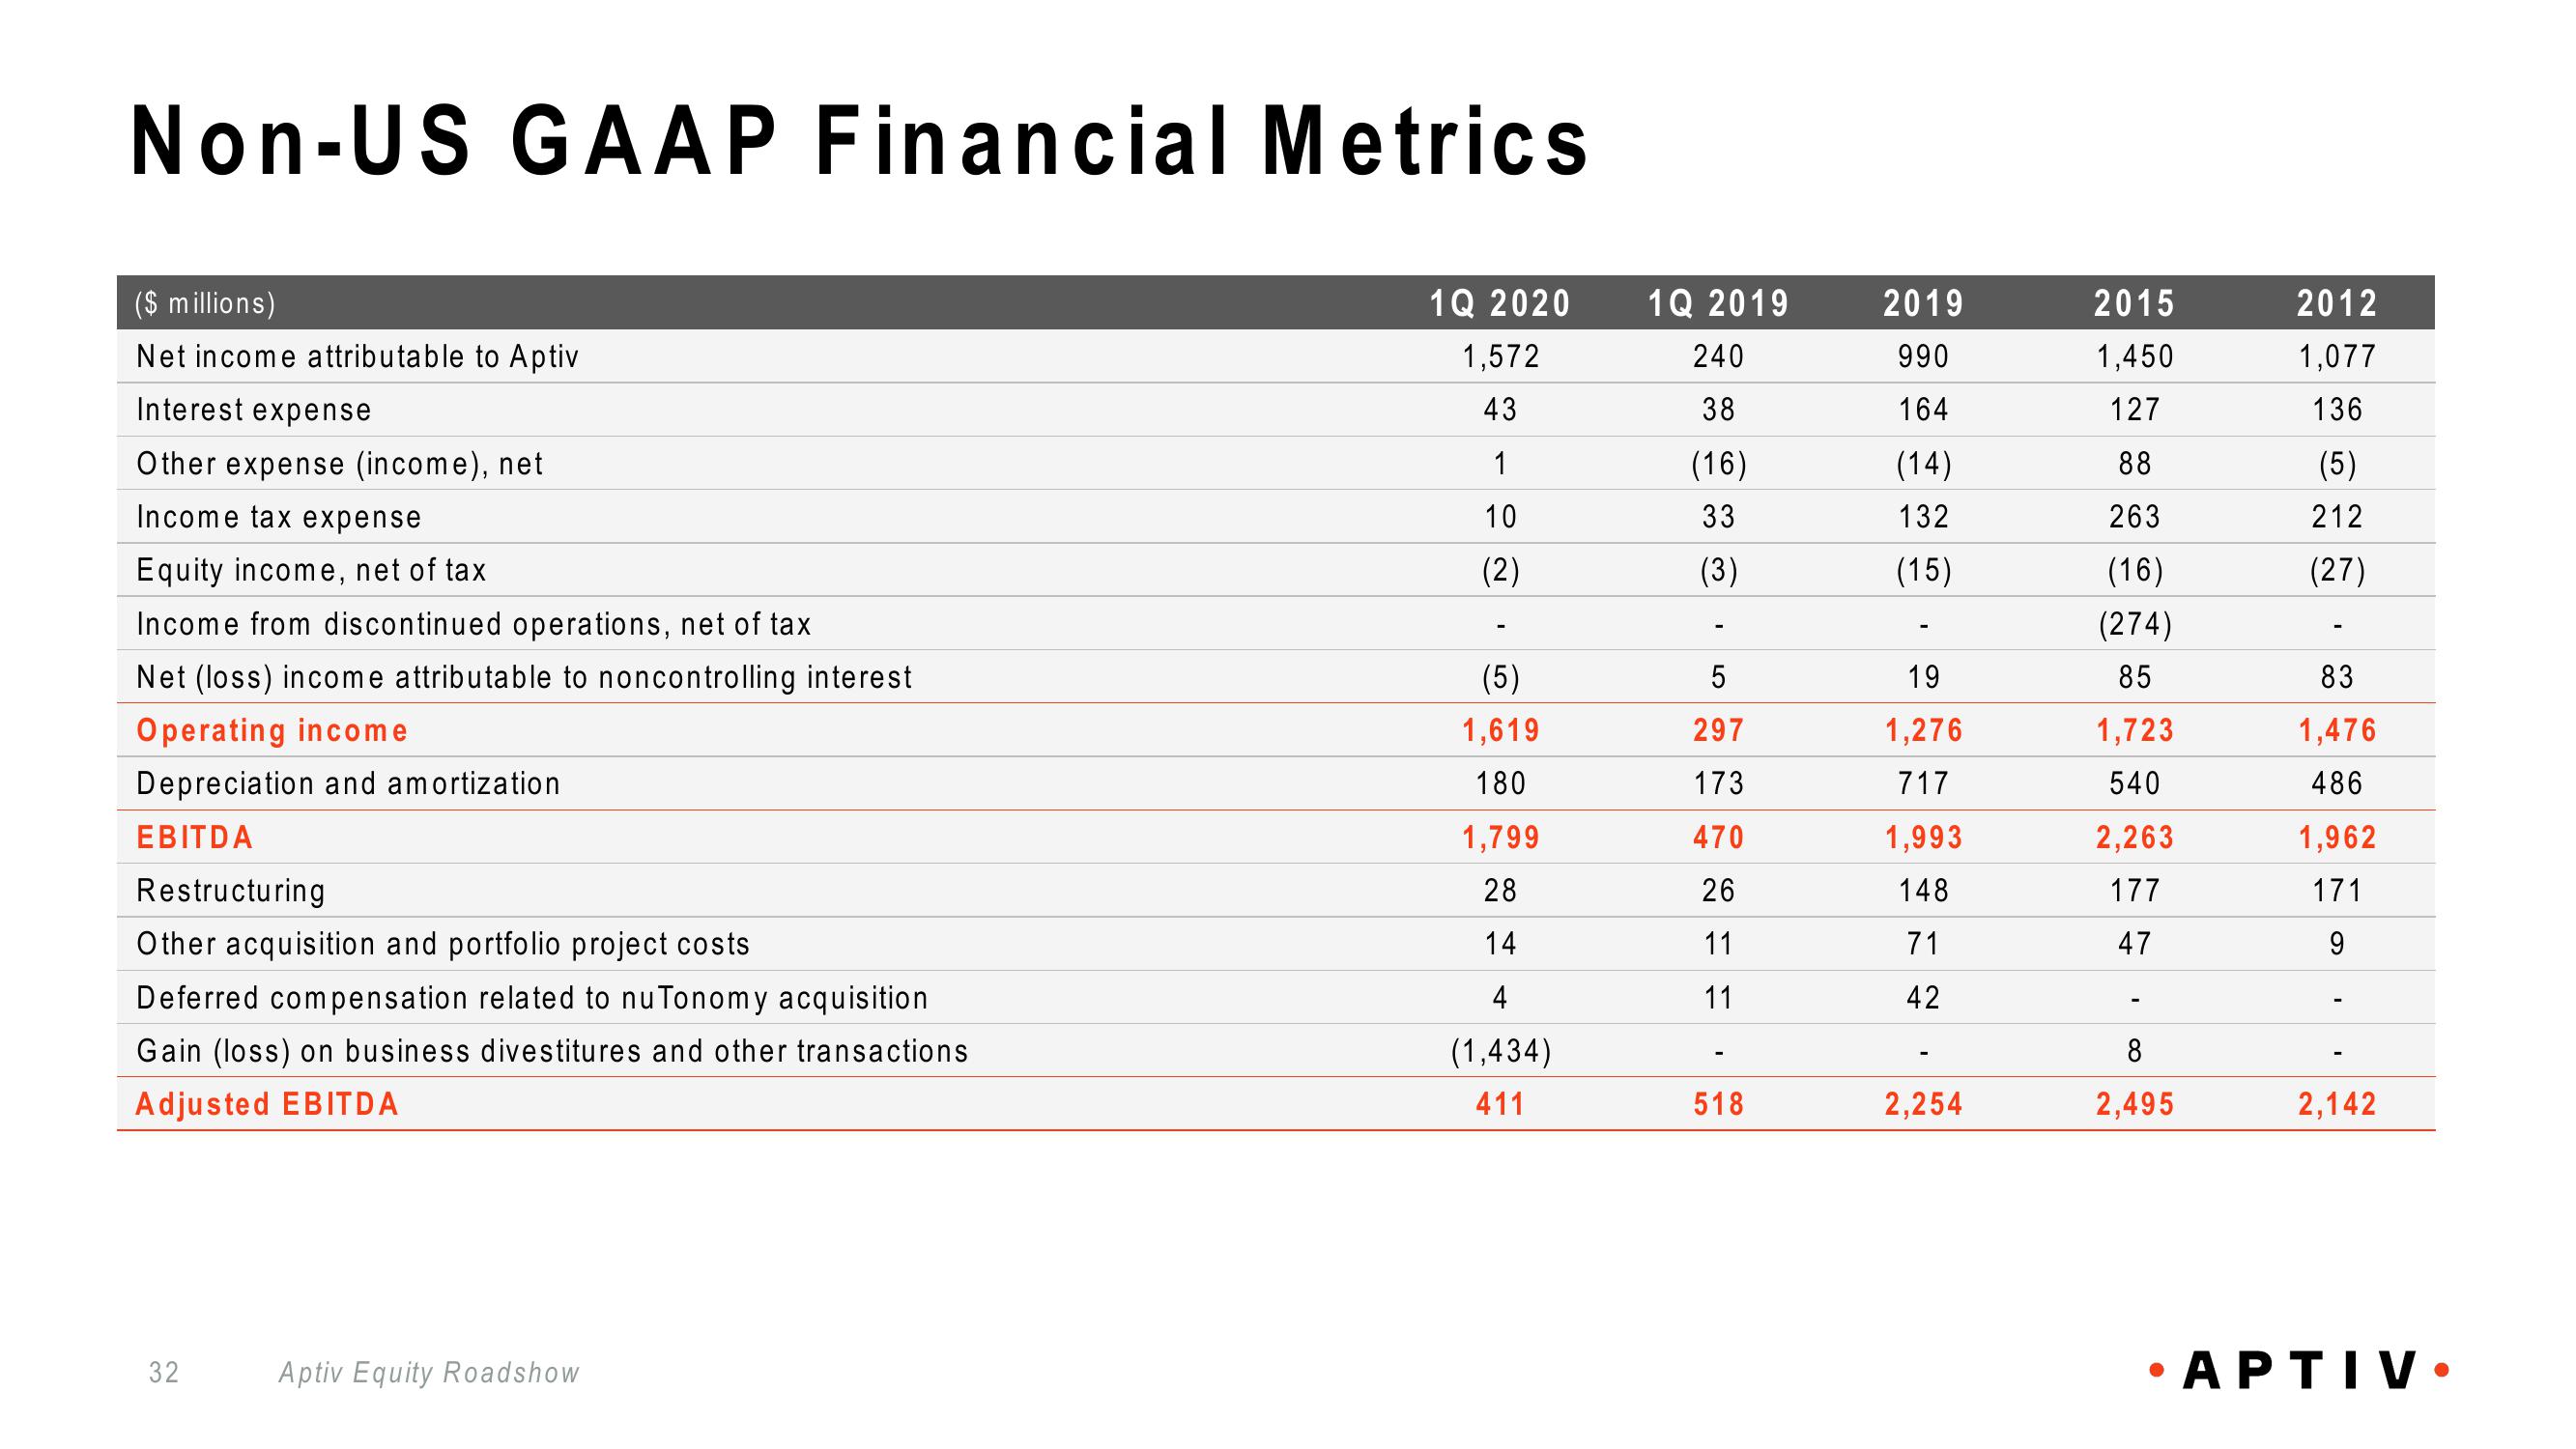
Non-US GAAP Financial Metrics
1Q 2020
1,572
43
1
10
(2)
($ millions)
Net income attributable to Aptiv
Interest expense
Other expense (income), net
Income tax expense
Equity income, net of tax
Income from discontinued operations, net of tax
Net (loss) income attributable to noncontrolling interest
Operating income
Depreciation and amortization
EBITDA
Restructuring
Other acquisition and portfolio project costs
Deferred compensation related to nu Tonomy acquisition
Gain (loss) on business divestitures and other transactions
Adjusted EBITDA
32
Aptiv Equity Roadshow
-
(5)
1,619
180
1,799
28
14
4
(1,434)
411
1Q 2019
240
38
(16)
33
(3)
5
297
173
470
26
11
11
-
518
2019
990
164
(14)
132
(15)
19
1,276
717
1,993
148
71
42
2,254
2015
1,450
127
88
263
(16)
(274)
85
1,723
540
2,263
177
47
8
2,495
2012
1,077
136
(5)
212
(27)
83
1,476
486
1,962
171
9
2,142
•APTIV.View entire presentation