J.P.Morgan Results Presentation Deck
Asset & Wealth Management¹
SELECTED INCOME STATEMENT DATA ($MM)
Revenue
Asset Management
Global Private Bank
Expense
Credit costs
Net income
Average equity
ROE
Pretax margin
Assets under management ("AUM")
KEY DRIVERS / STATISTICS ($B)²
Client assets
Reported
$5,095
2,403
Average loans
Average deposits
2,692
3,388
(1)
$1,217
Note: Totals may not sum due to rounding
1 See note 1 on slide 13
2 Actual numbers for all periods, not over/(under)
JPMORGAN CHASE & CO.
Reported
$17.0
28%
34
$3,422
5,012
227.0
226.6
4Q23
FR impact
$432
432
33
4Q23
13
$292
FR impact
$1.0
6%
5
12
11.7
11.2
ex. FR
$4,663
2,403
2,260
3,355
(14)
$925
ex. FR
$16.0
22%
28
$3,422
5,000
215.3
215.4
ex. FR $ 0/(U)
3Q23
$94
239
ex. FR
(145) (170)
234
3Q23
$16.0
(32) (46)
($150) ($209)
26%
31
$3,186
4,644
4Q22
210.8
$75
202.0
245
333
4Q22
$17.0
26%
33
$2,766
4,048
214.2
237.0
CCB
CIB
AWM Corp.
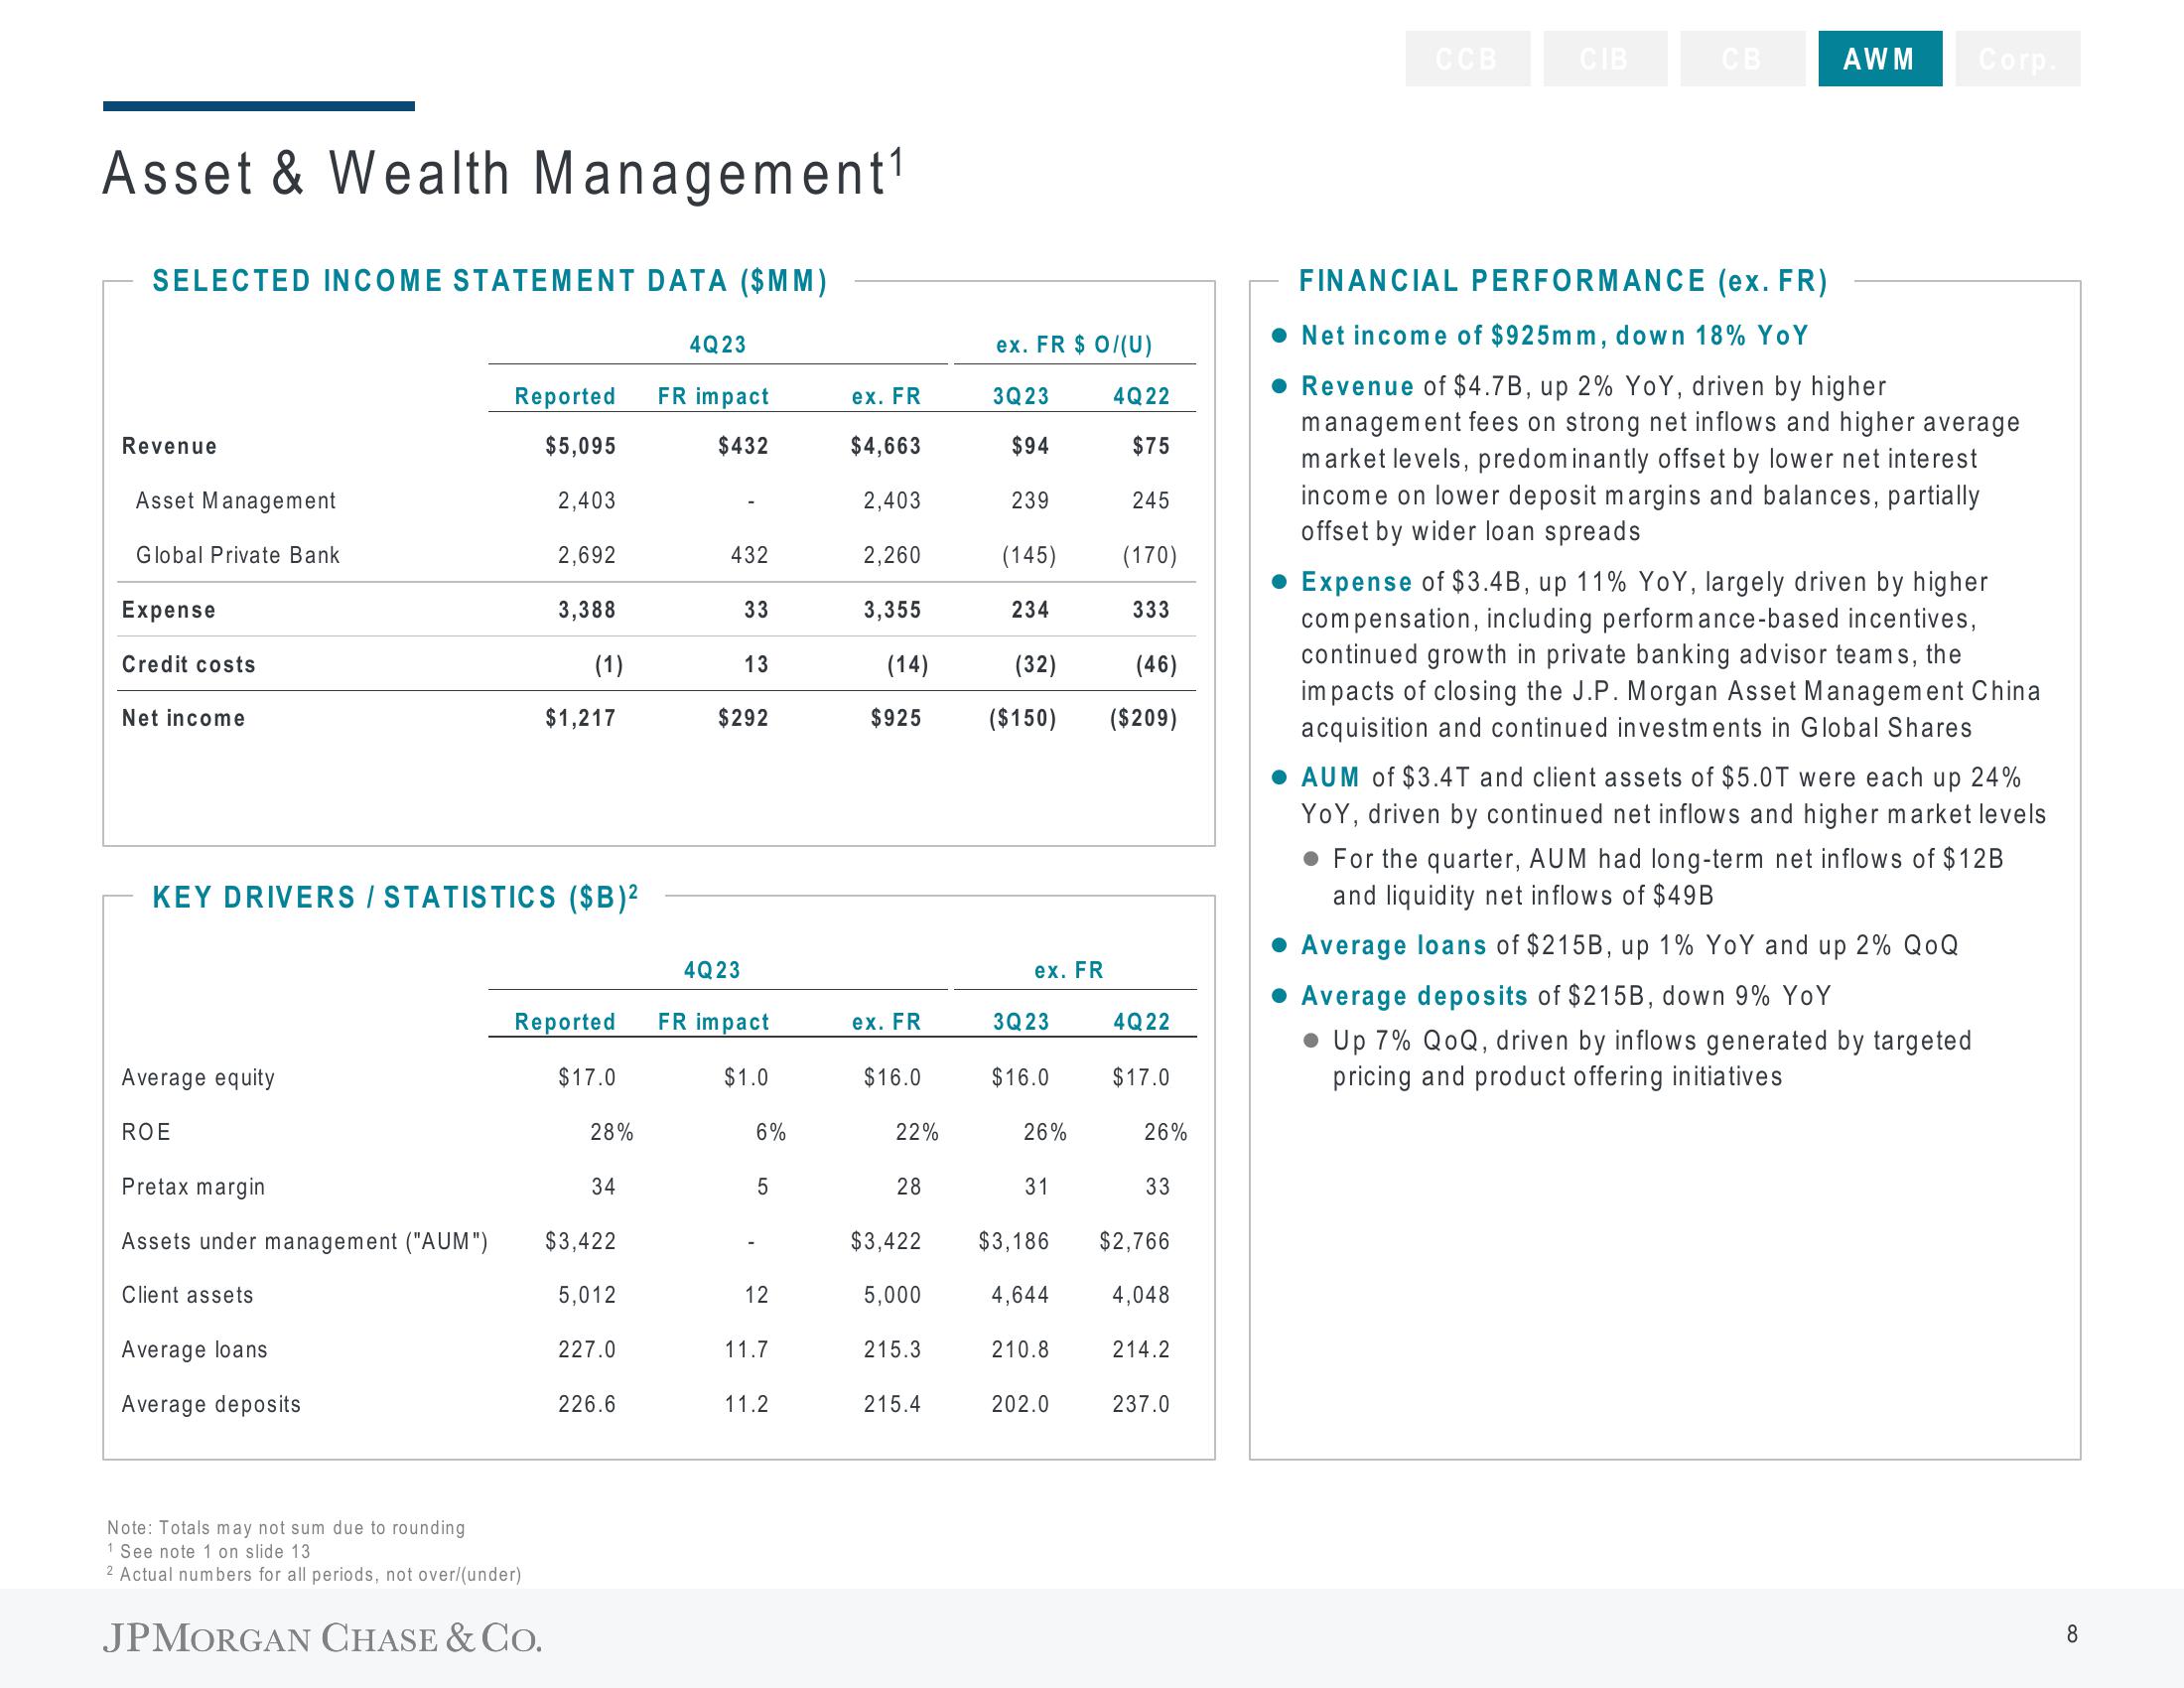
FINANCIAL PERFORMANCE (ex. FR)
Net income of $925mm, down 18% YoY
Revenue of $4.7B, up 2% YoY, driven by higher
management fees on strong net inflows and higher average
market levels, predominantly offset by lower net interest
income on lower deposit margins and balances, partially
offset by wider loan spreads
Expense of $3.4B, up 11% YoY, largely driven by higher
compensation, including performance-based incentives,
continued growth in private banking advisor teams, the
impacts of closing the J.P. Morgan Asset Management China
acquisition and continued investments in Global Shares
AUM of $3.4T and client assets of $5.0T were each up 24%
YoY, driven by continued net inflows and higher market levels
. For the quarter, AUM had long-term net inflows of $12B
and liquidity net inflows of $49B
Average loans of $215B, up 1% YoY and up 2% QOQ
Average deposits of $215B, down 9% YoY
Up 7% QoQ, driven by inflows generated by targeted
pricing and product offering initiatives
8View entire presentation