Shopify Investor Presentation Deck
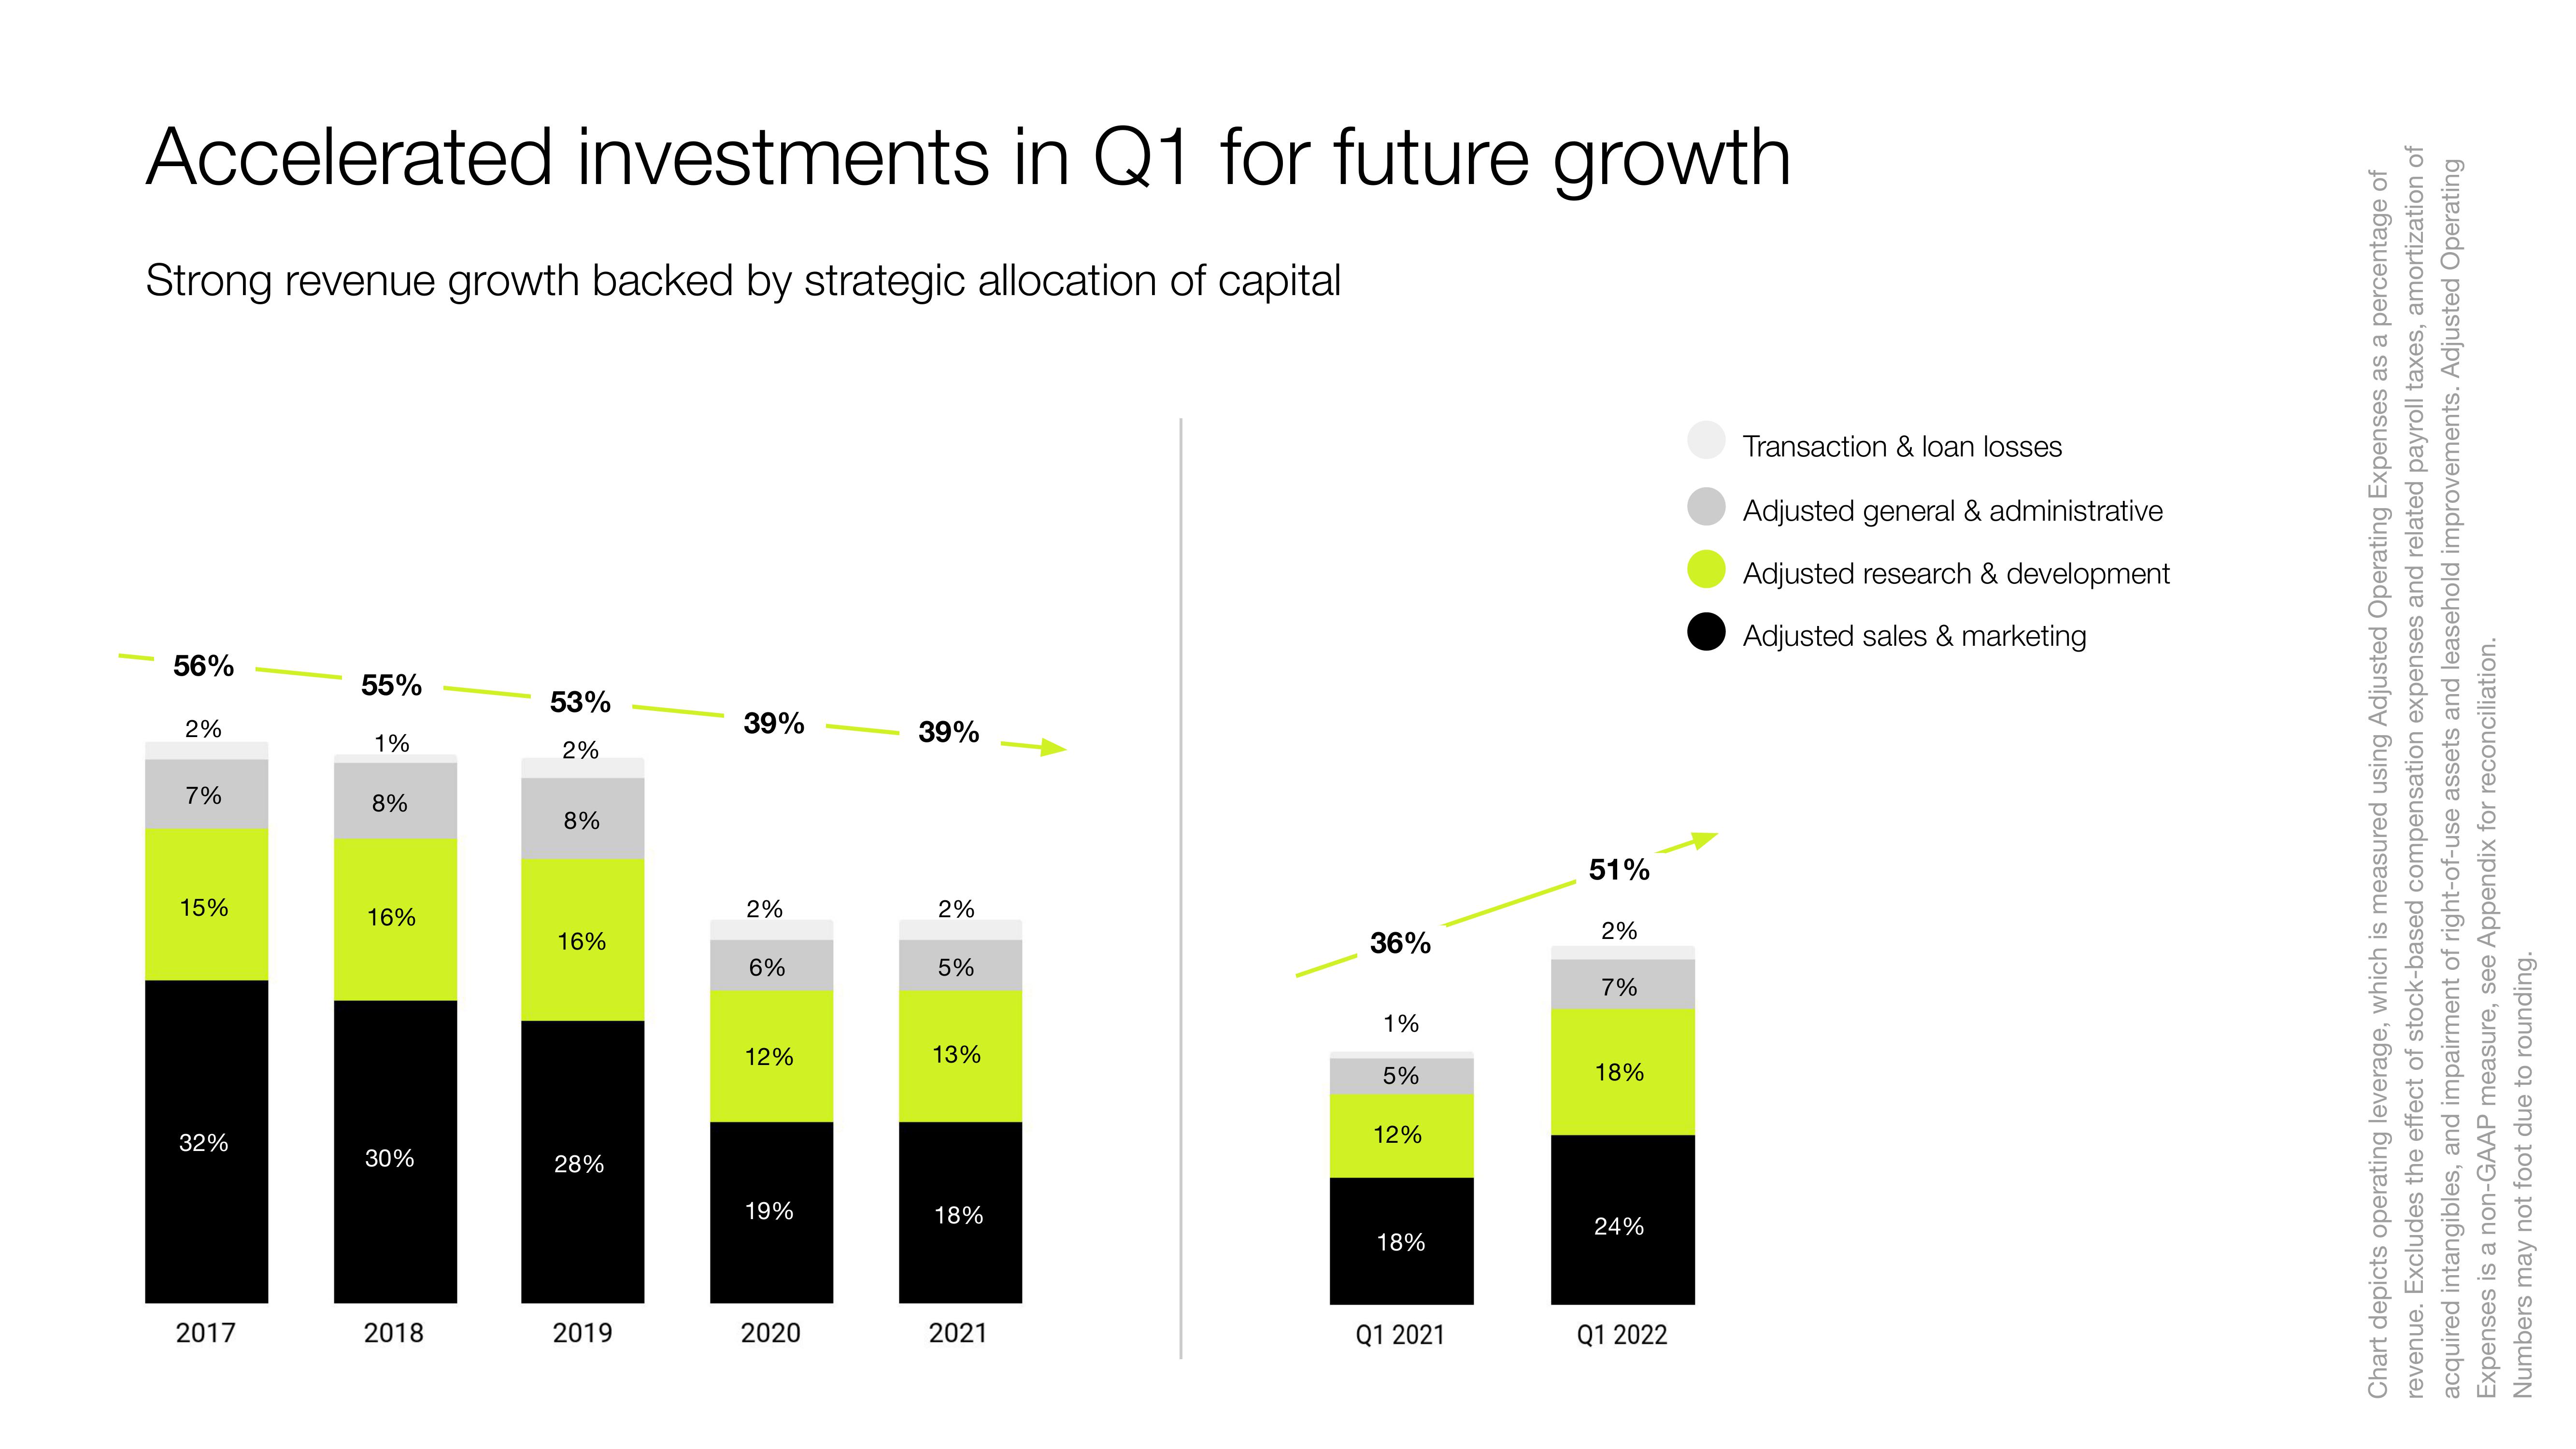
Accelerated investments in Q1 for future growth
Strong revenue growth backed by strategic allocation of capital
56%
2%
7%
15%
32%
2017
55%
1%
8%
16%
30%
2018
53%
2%
8%
16%
28%
2019
39%
2%
6%
12%
19%
2020
39%
2%
5%
13%
18%
2021
36%
1%
5%
12%
18%
Q1 2021
51%
2%
7%
18%
24%
Q1 2022
Transaction & loan losses
Adjusted general & administrative
Adjusted research & development
Adjusted sales & marketing
Chart depicts operating leverage, which is measured using Adjusted Operating Expenses as a percentage of
revenue. Excludes the effect of stock-based compensation expenses and related payroll taxes, amortization of
acquired intangibles, and impairment of right-of-use assets and leasehold improvements. Adjusted Operating
Expenses is a non-GAAP measure, see Appendix for reconciliation.
Numbers may not foot due to rounding.View entire presentation