Sonos Investor Presentation Deck
Diversified Channel Distribution
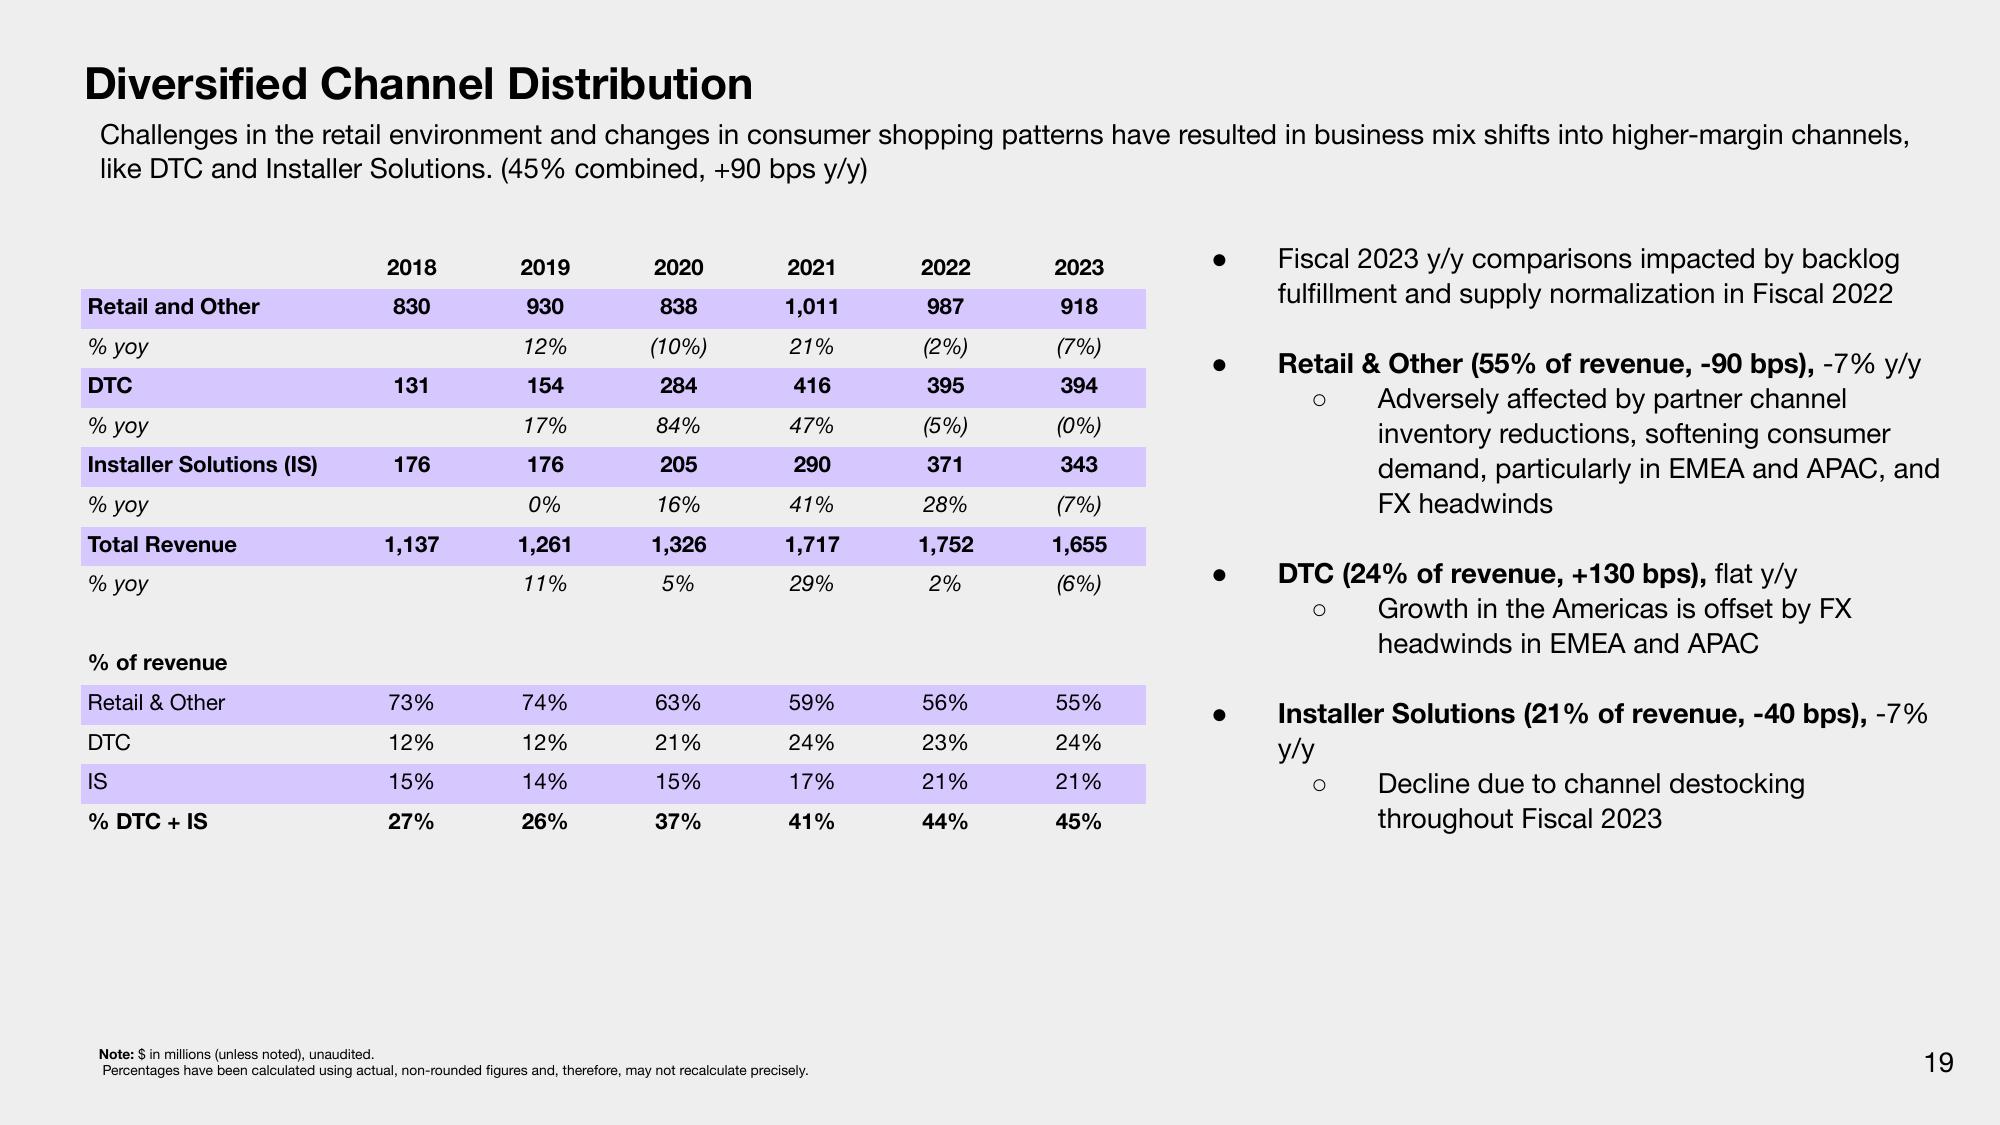
Challenges in the retail environment and changes in consumer shopping patterns have resulted in business mix shifts into higher-margin channels,
like DTC and Installer Solutions. (45% combined, +90 bps y/y)
Retail and Other
% yoy
DTC
% yoy
Installer Solutions (IS)
% yoy
Total Revenue
% yoy
% of revenue
Retail & Other
DTC
IS
% DTC + IS
2018
830
131
176
1,137
73%
12%
15%
27%
2019
930
12%
154
17%
176
0%
1,261
11%
74%
12%
14%
26%
2020
838
(10%)
284
84%
205
16%
1,326
5%
63%
21%
15%
37%
2021
1,011
21%
416
47%
290
41%
1,717
29%
59%
24%
17%
41%
Note: $ in millions (unless noted), unaudited.
Percentages have been calculated using actual, non-rounded figures and, therefore, may not recalculate precisely.
2022
987
(2%)
395
(5%)
371
28%
1,752
2%
56%
23%
21%
44%
2023
918
(7%)
394
(0%)
343
(7%)
1,655
(6%)
55%
24%
21%
45%
Fiscal 2023 y/y comparisons impacted by backlog
fulfillment and supply normalization in Fiscal 2022
Retail & Other (55% of revenue, -90 bps), -7% y/y
Adversely affected by partner channel
O
inventory reductions, softening consumer
demand, particularly in EMEA and APAC, and
FX headwinds
DTC (24% of revenue, +130 bps), flat y/y
O
Growth in the Americas is offset by FX
headwinds in EMEA and APAC
Installer Solutions (21% of revenue, -40 bps), -7%
y/y
O
Decline due to channel destocking
throughout Fiscal 2023
19View entire presentation