Nexters SPAC Presentation Deck
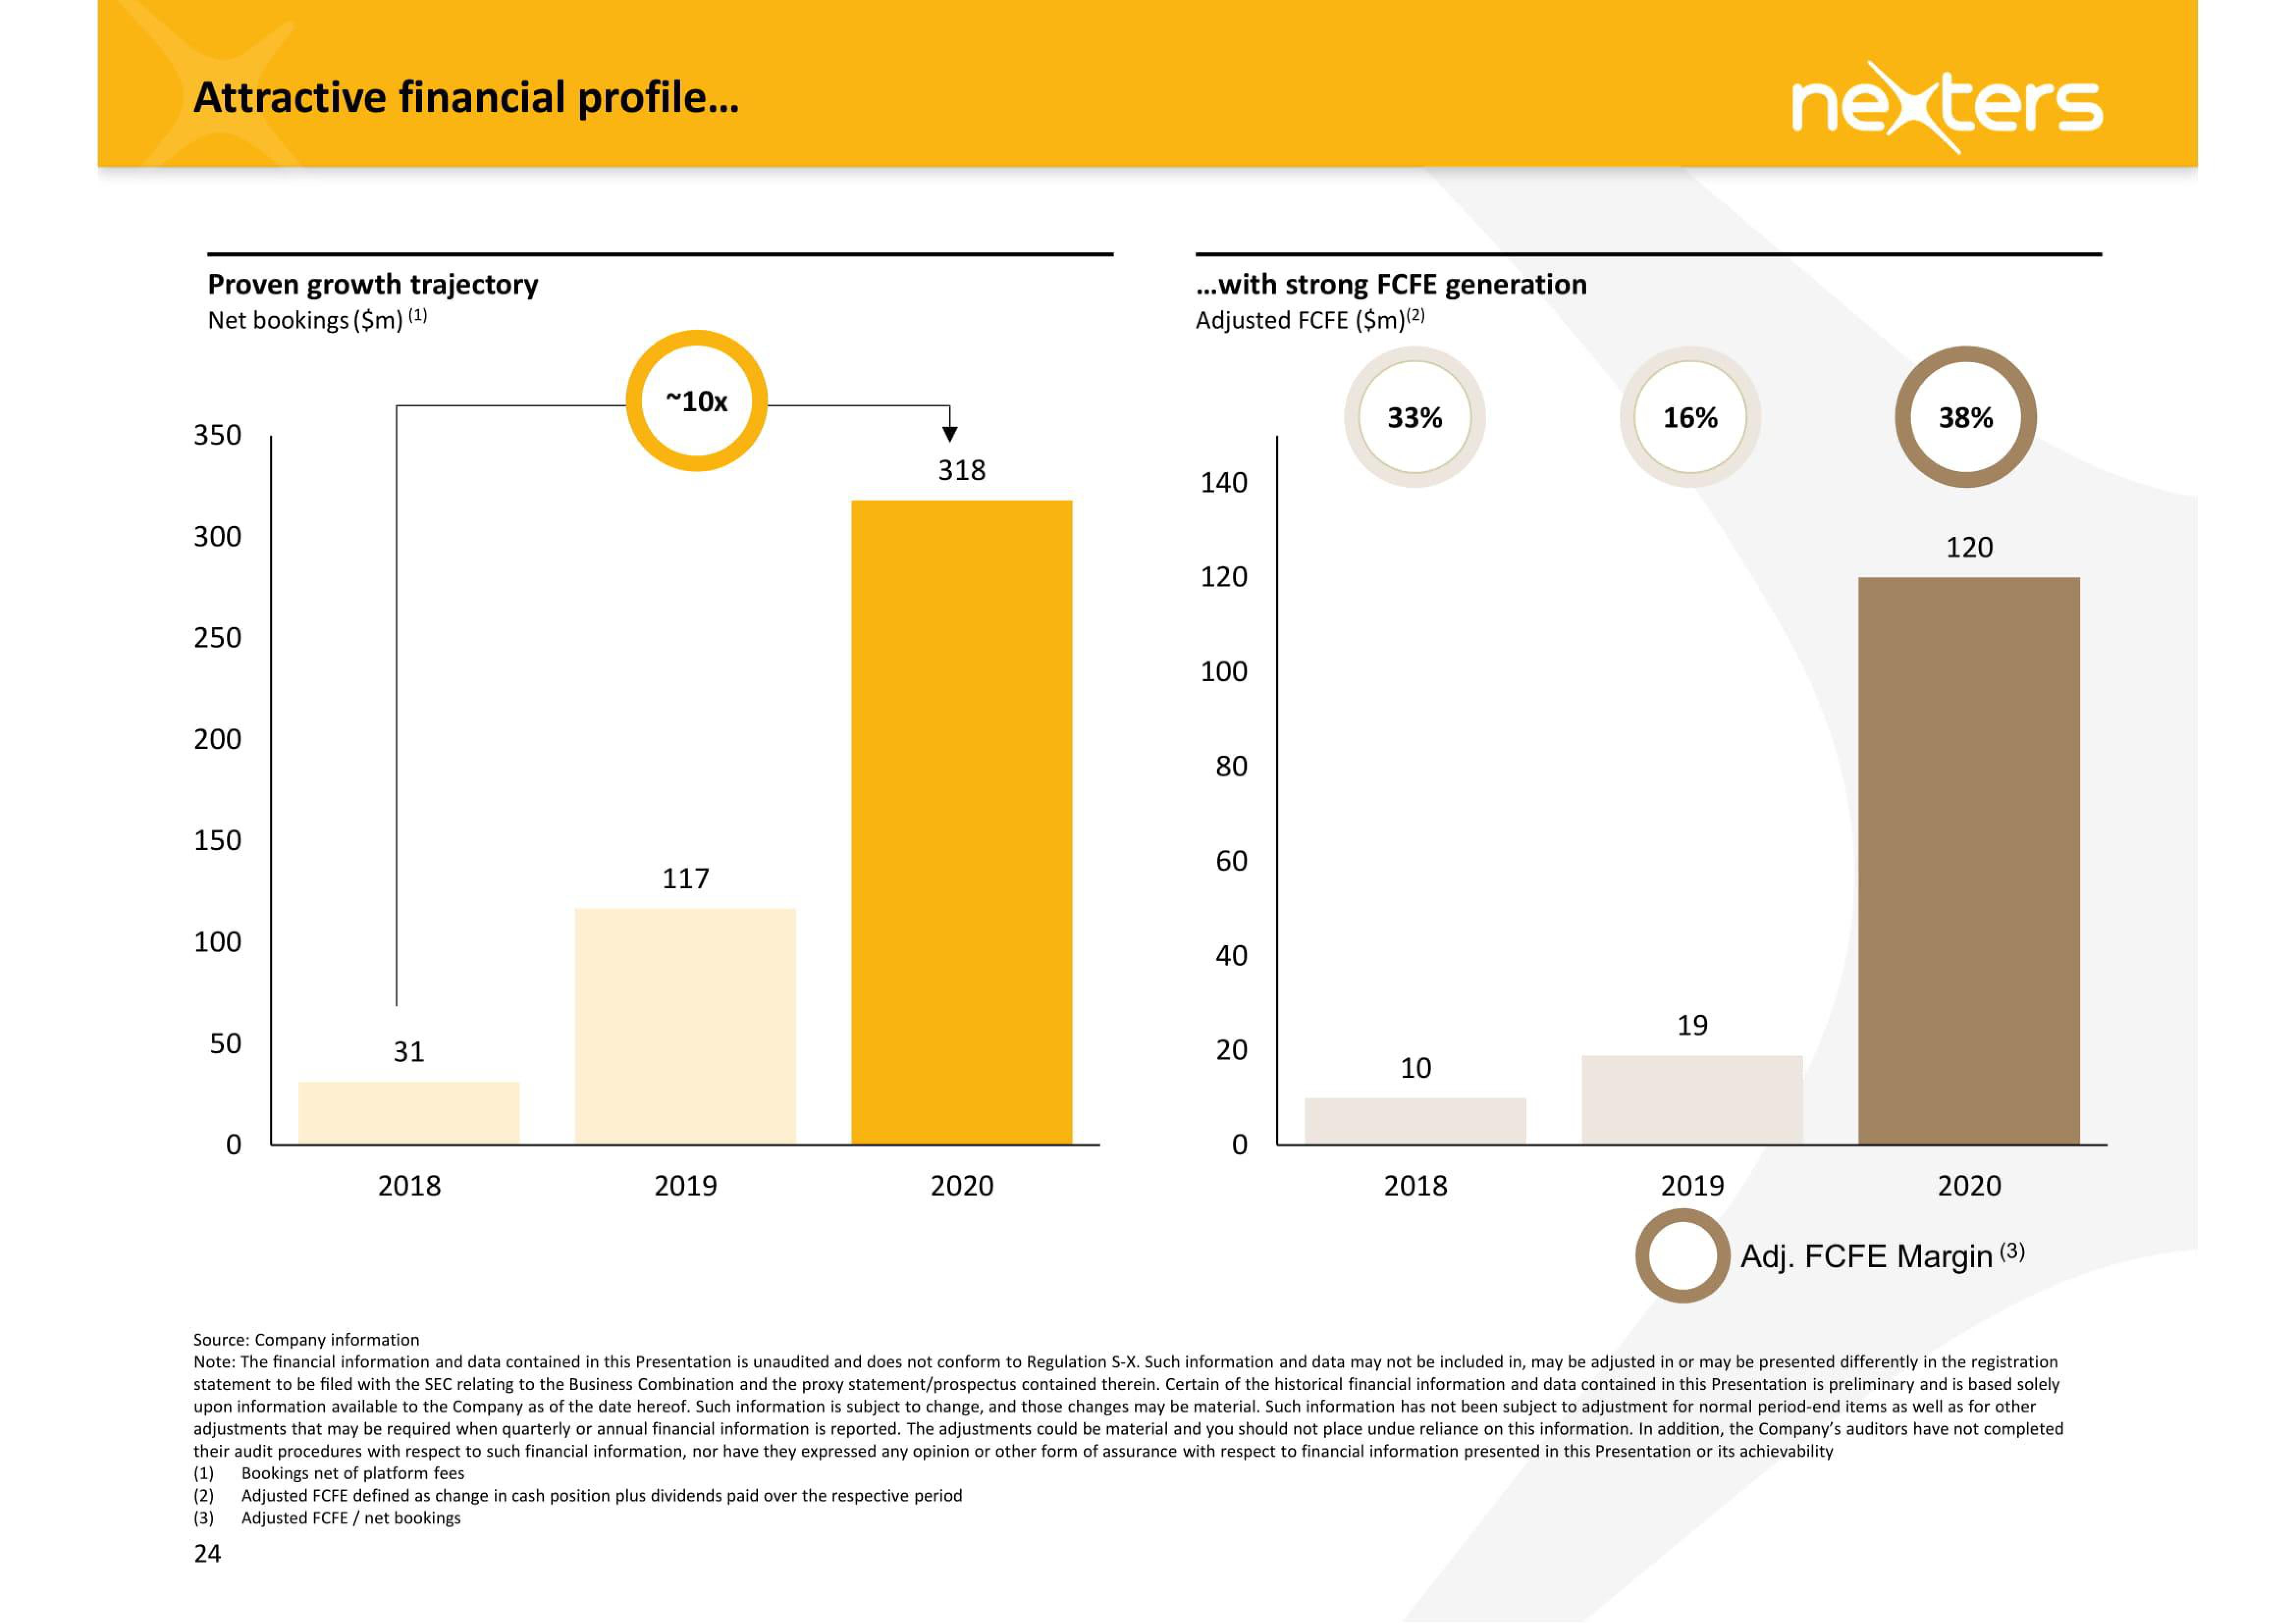
Attractive financial profile...
Proven growth trajectory
Net bookings ($m) (1)
350
300
250
200
150
100
50
0
31
2018
~10x
117
2019
318
2020
...with strong FCFE generation
Adjusted FCFE ($m) (2)
140
120
100
80
60
40
20
0
33%
10
2018
16%
19
2019
O
nexters
38%
120
2020
Adj. FCFE Margin (3)
Source: Company information
Note: The financial information and data contained in this Presentation is unaudited and does not conform to Regulation S-X. Such information and data may not be included in, may be adjusted in or may be presented differently in the registration
statement to be filed with the SEC relating to the Business Combination and the proxy statement/prospectus contained therein. Certain of the historical financial information and data contained in this Presentation is preliminary and is based solely
upon information available to the Company as of the date hereof. Such information is subject to change, and those changes may be material. Such information has not been subject to adjustment for normal period-end items as well as for other
adjustments that may be required when quarterly or annual financial information is reported. The adjustments could be material and you should not place undue reliance on this information. In addition, the Company's auditors have not completed
their audit procedures with respect to such financial information, nor have they expressed any opinion or other form of assurance with respect to financial information presented in this Presentation or its achievability
(1) Bookings net of platform fees
(2) Adjusted FCFE defined as change in cash position plus dividends paid over the respective period
(3)
Adjusted FCFE/ net bookings
24View entire presentation