AstraZeneca Results Presentation Deck
BioPharmaceuticals: Respiratory & Immunology
Total Revenue ($m)
800
700
600
500
400
300
200
100
☐EM
0
EROW
■ Europe
US
Q2
141
99
176
264
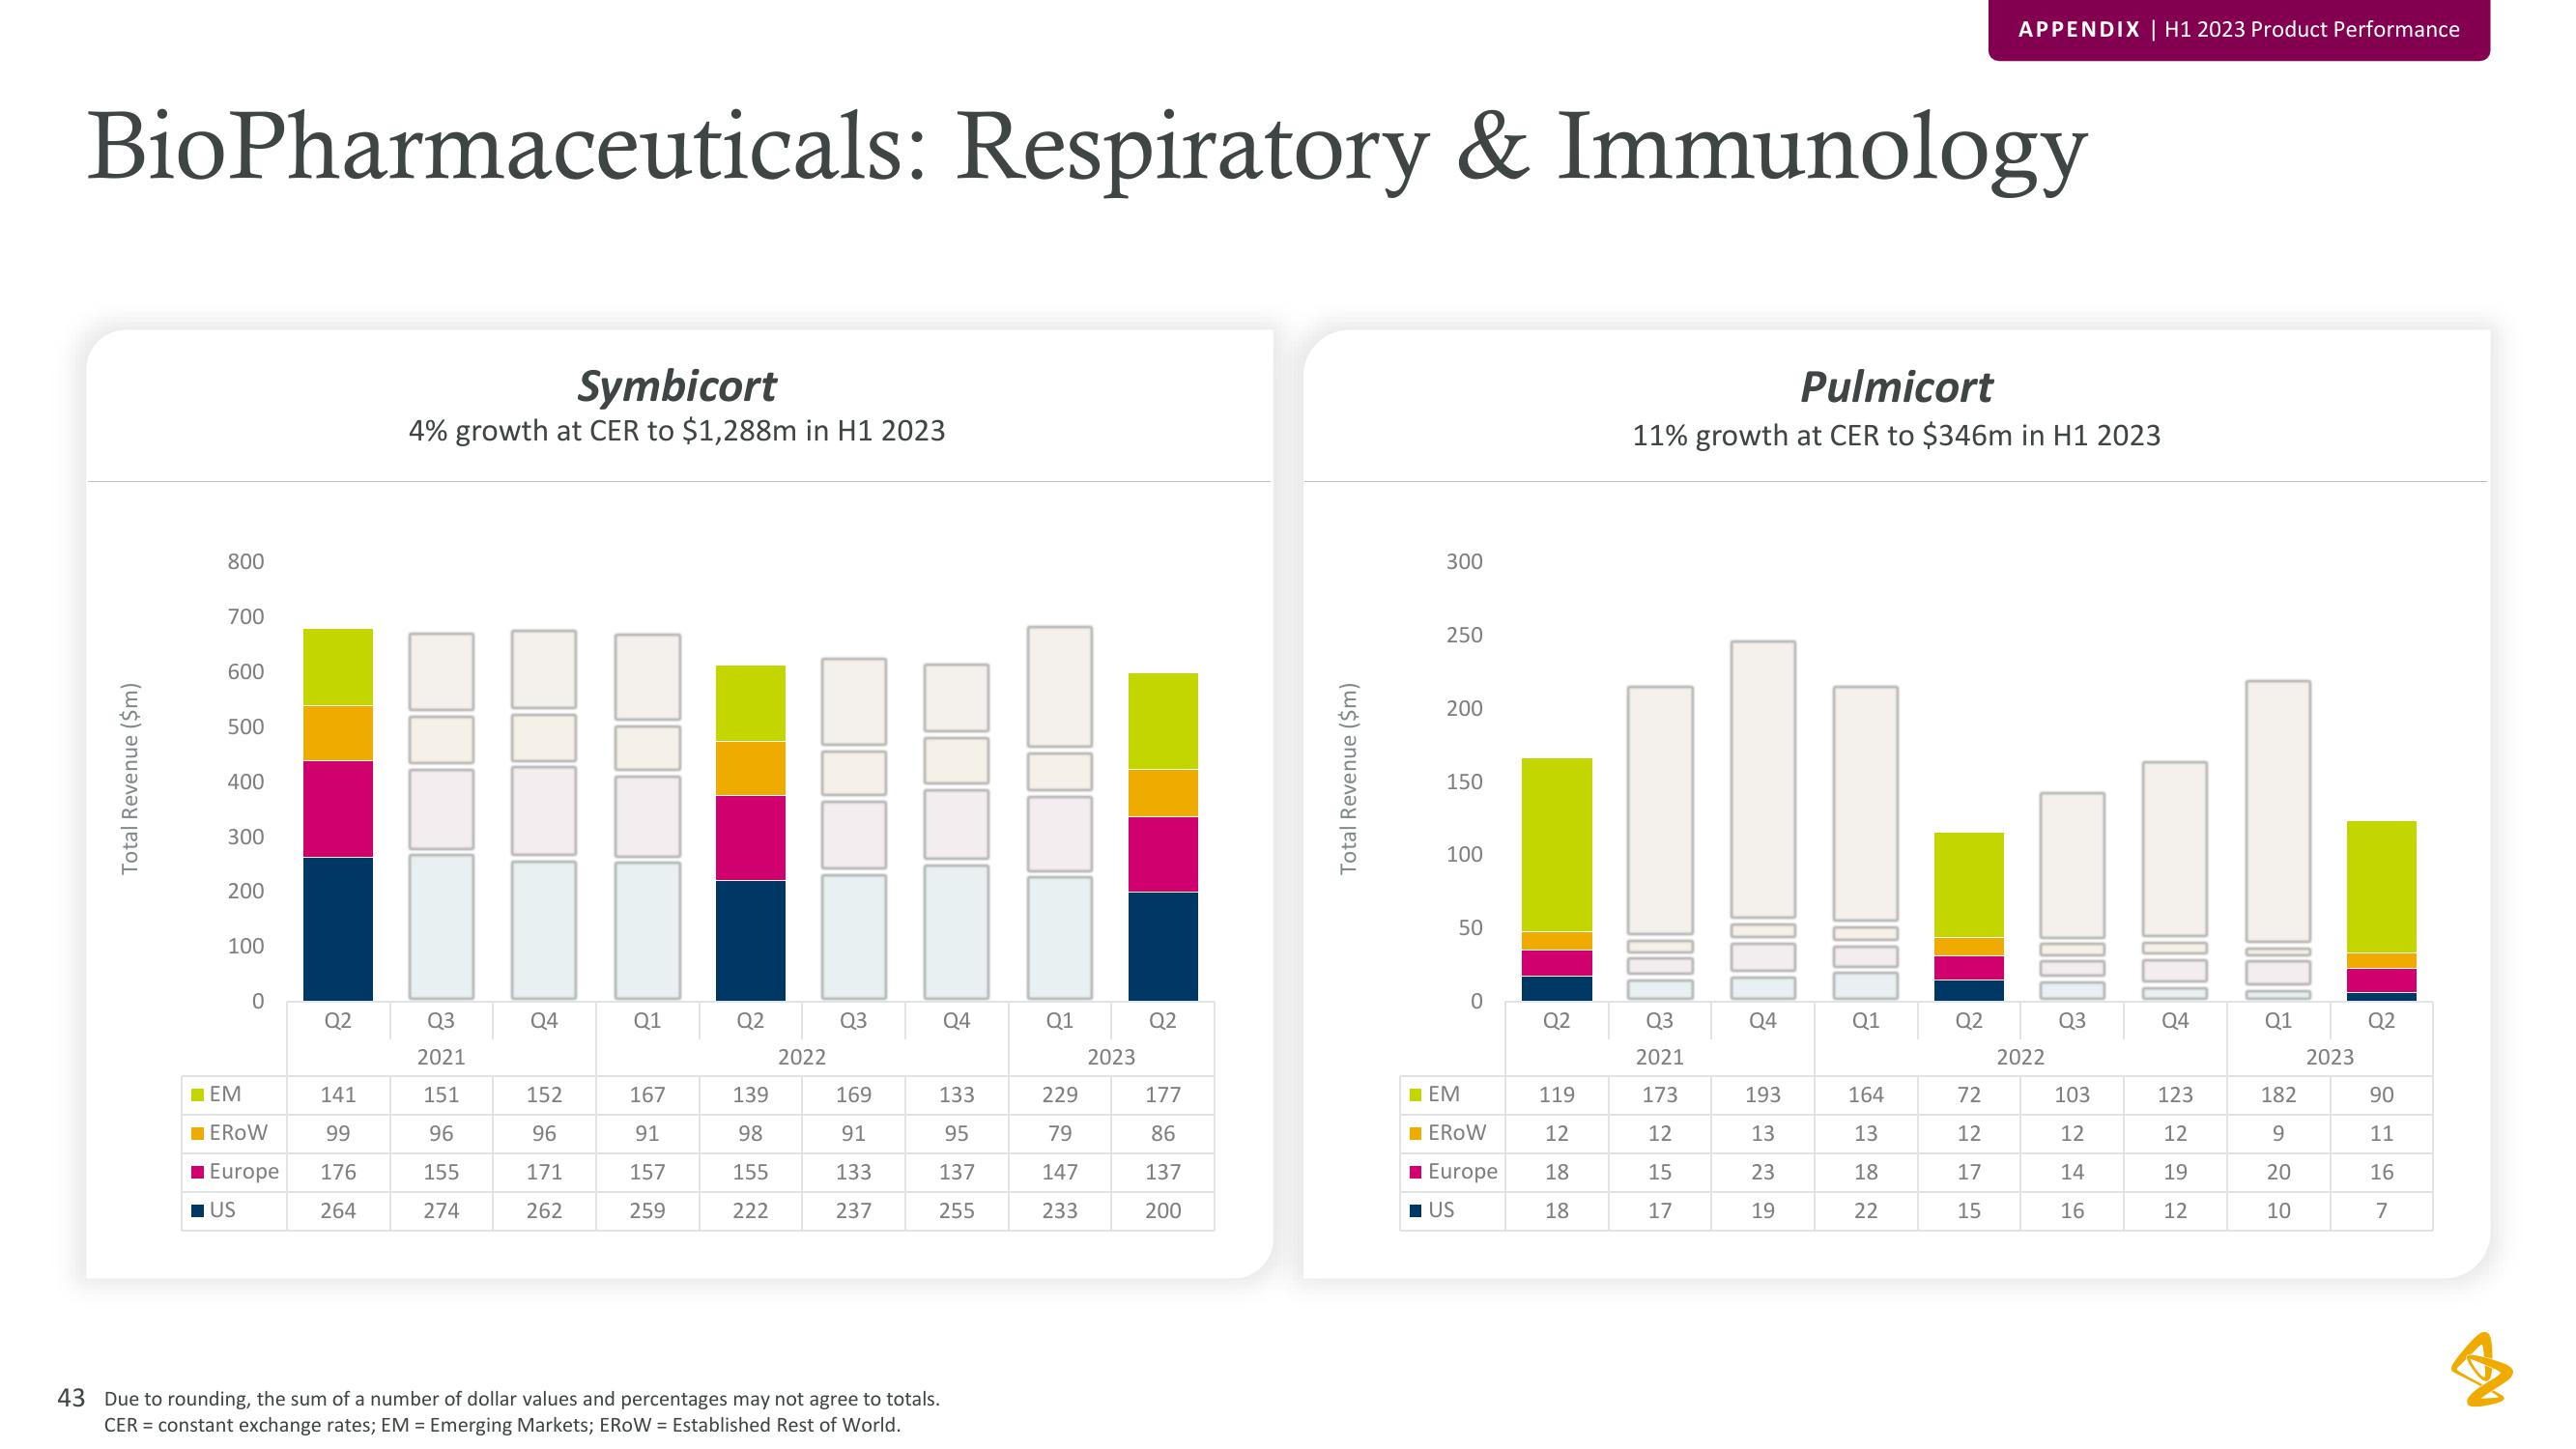
Symbicort
4% growth at CER to $1,288m in H1 2023
Q3
2021
151
96
155
274
Q4
152
96
171
262
Q1
167
91
157
259
Q2
139
98
155
222
2022
Q3
169
91
133
237
Q4
133
95
137
255
43 Due to rounding, the sum of a number of dollar values and percentages may not agree to totals.
CER = constant exchange rates; EM = Emerging Markets; EROW= Established Rest of World.
Q1
229
79
147
233
2023
Q2
177
86
137
200
Total Revenue ($m)
300
250
200
150
100
50
0
☐EM
☐EROW
Europe
US
Q2
119
12
18
18
Pulmicort
11% growth at CER to $346m in H1 2023
Q3
2021
173
12
15
17
Q4
193
13
23
19
Q1
164
13
18
22
APPENDIX | H1 2023 Product Performance
Q2
72
12
17
15
2022
Q3
103
12
14
16
Q4
123
12
19
12
Q1
182
9
20
10
2023
Q2
90
11
16
7View entire presentation