Paysafe Results Presentation Deck
Classic digital wallets
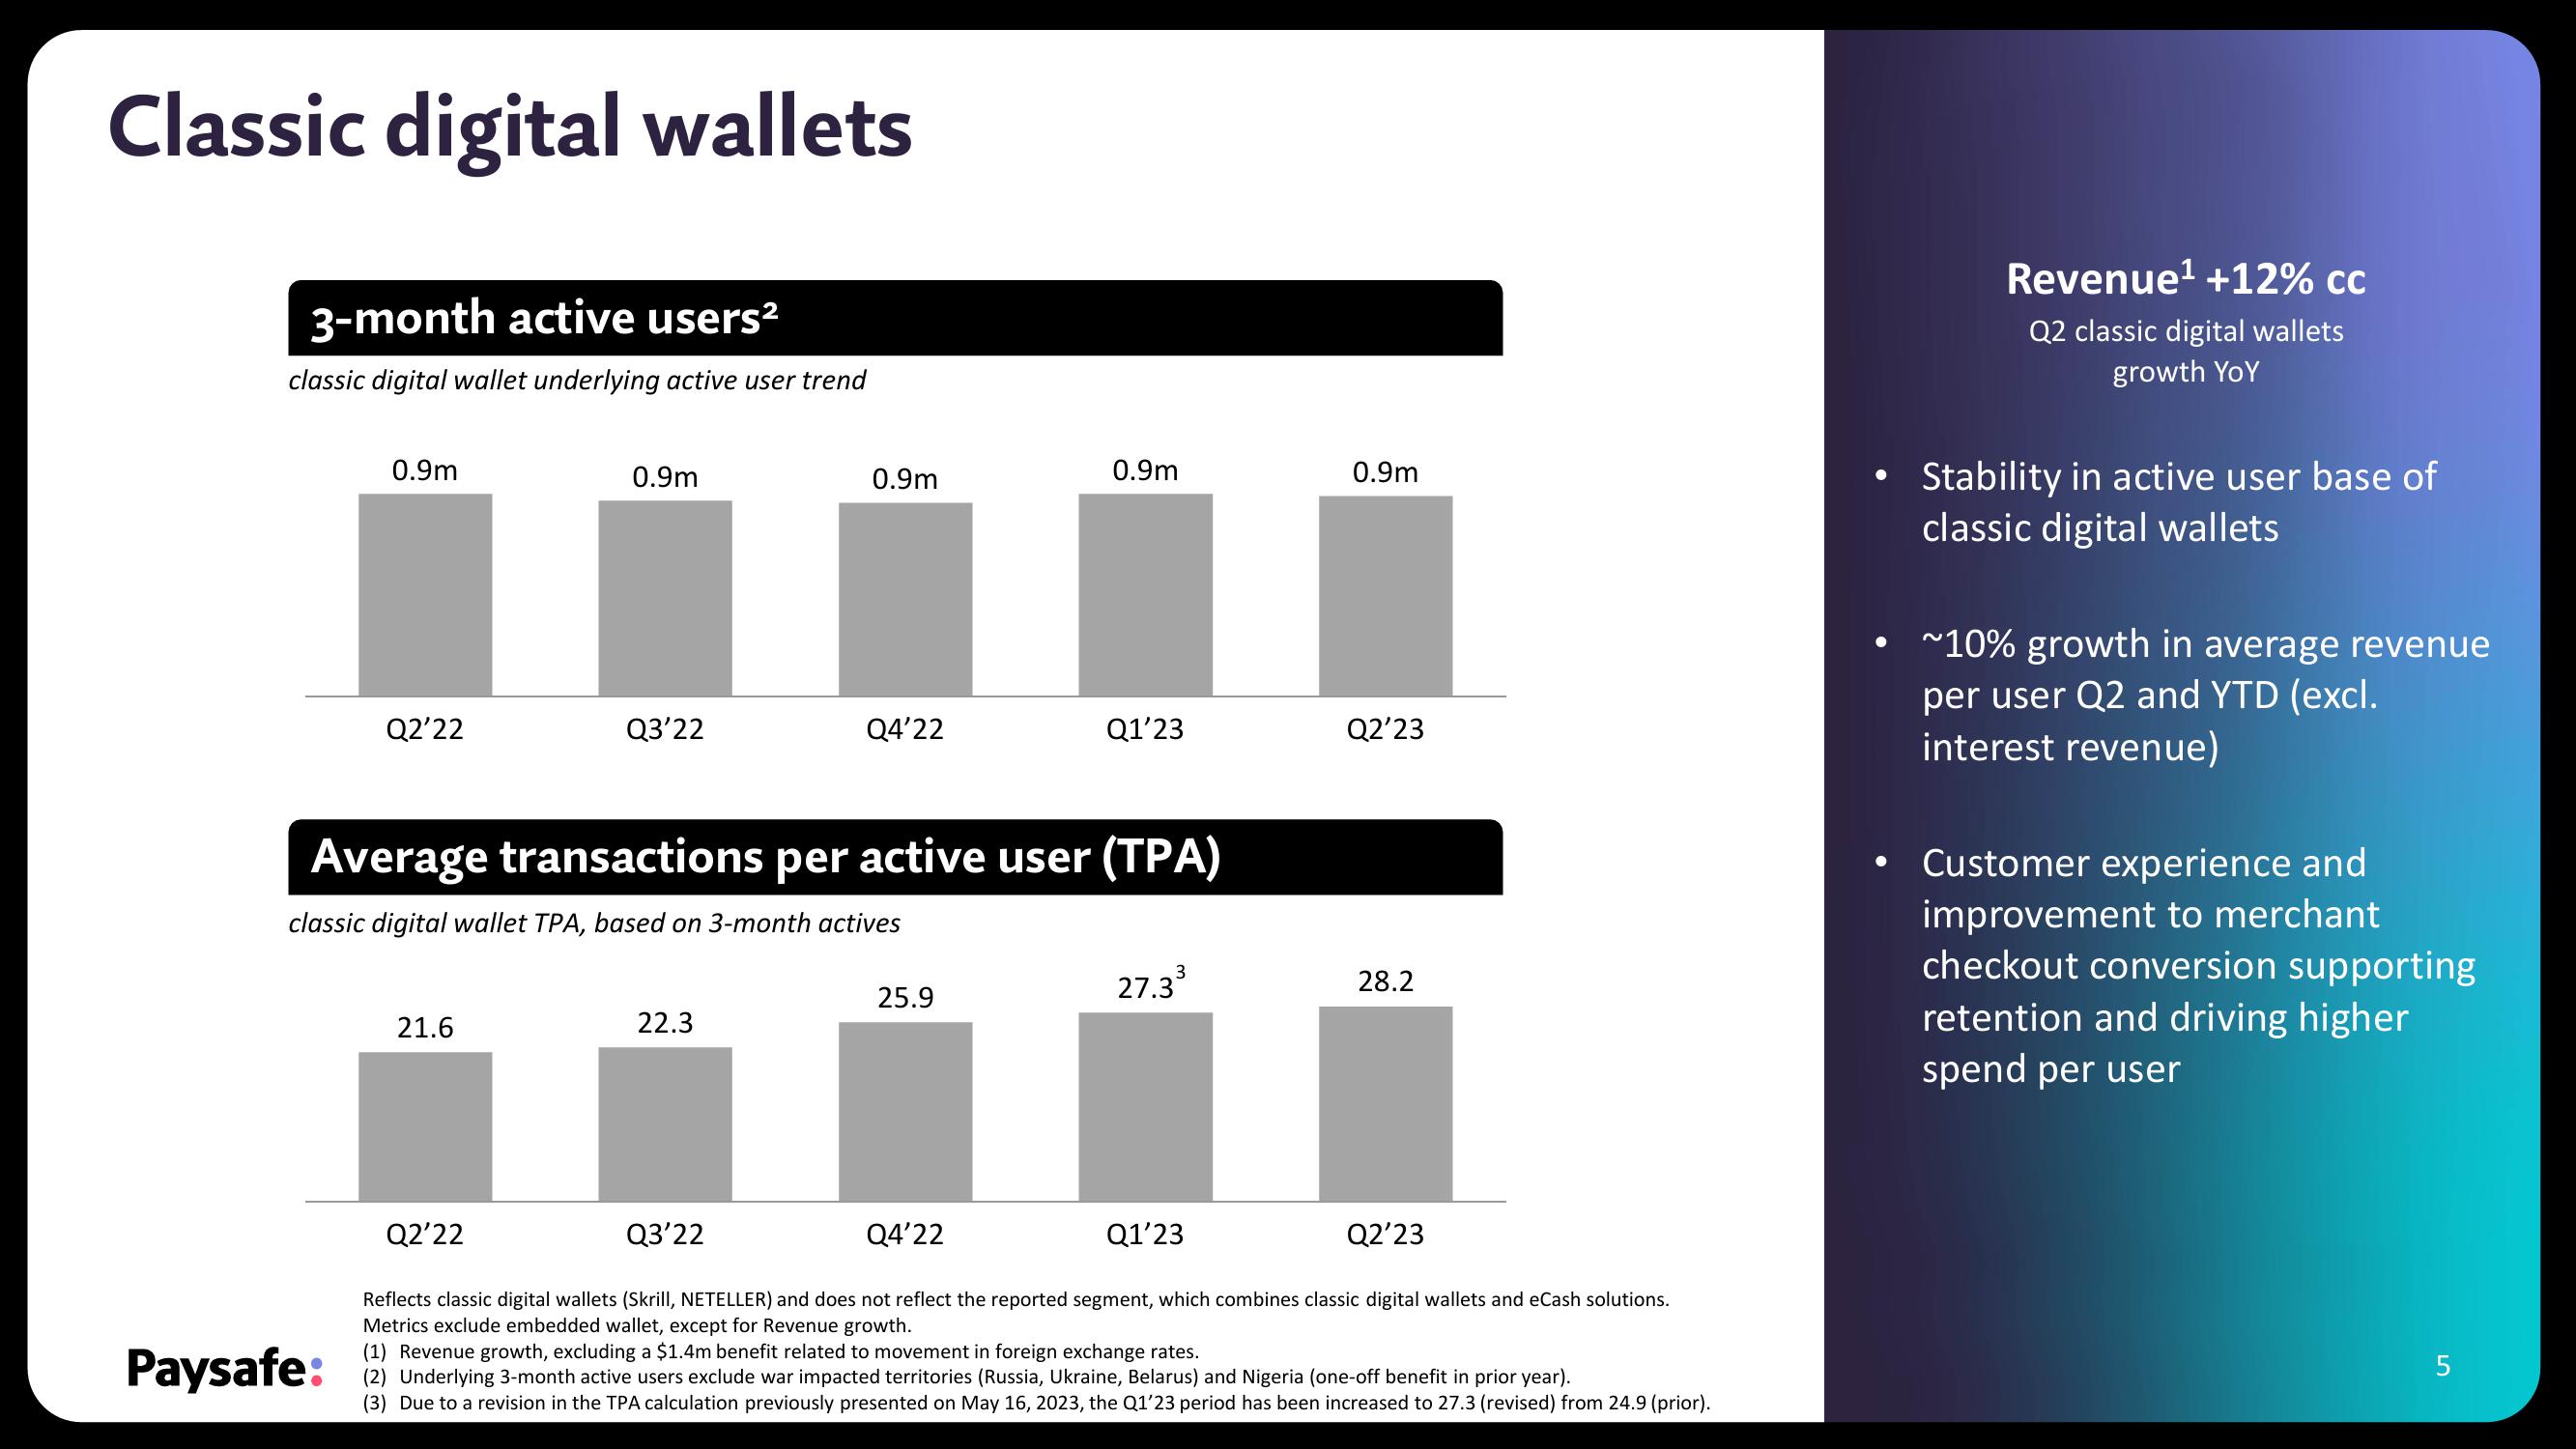
3-month active users²
classic digital wallet underlying active user trend
0.9m
Q2'22
21.6
0.9m
Q2'22
Q3'22
22.3
0.9m
Average transactions per active user (TPA)
classic digital wallet TPA, based on 3-month actives
Q4'22
Q3'22
25.9
0.9m
Q4'22
Q1'23
27.3³
Q1'23
Q2'23
Reflects classic digital wallets (Skrill, NETELLER) and does not reflect the reported segment, which combines classic digital wallets and eCash solutions.
Metrics exclude embedded wallet, except for Revenue growth.
Revenue excluding a $1.4m benefit related to movement in foreign exchange rates.
Paysafe: (2) Underlying 3-month active users exclude war impacted territories (Russia, Ukraine, Belarus) and Nigeria (one-off benefit in prior year).
(3) Due to a revision in the TPA calculation previously presented on May 16, 2023, the Q1'23 period has been increased to 27.3 (revised) from 24.9 (prior).
0.9m
Q2'23
28.2
Revenue¹ +12% cc
Q2 classic digital wallets
growth YoY
Stability in active user base of
classic digital wallets
~10% growth in average revenue
per user Q2 and YTD (excl.
interest revenue)
Customer experience and
improvement to merchant
checkout conversion supporting
retention and driving higher
spend per user
5View entire presentation