TPG Results Presentation Deck
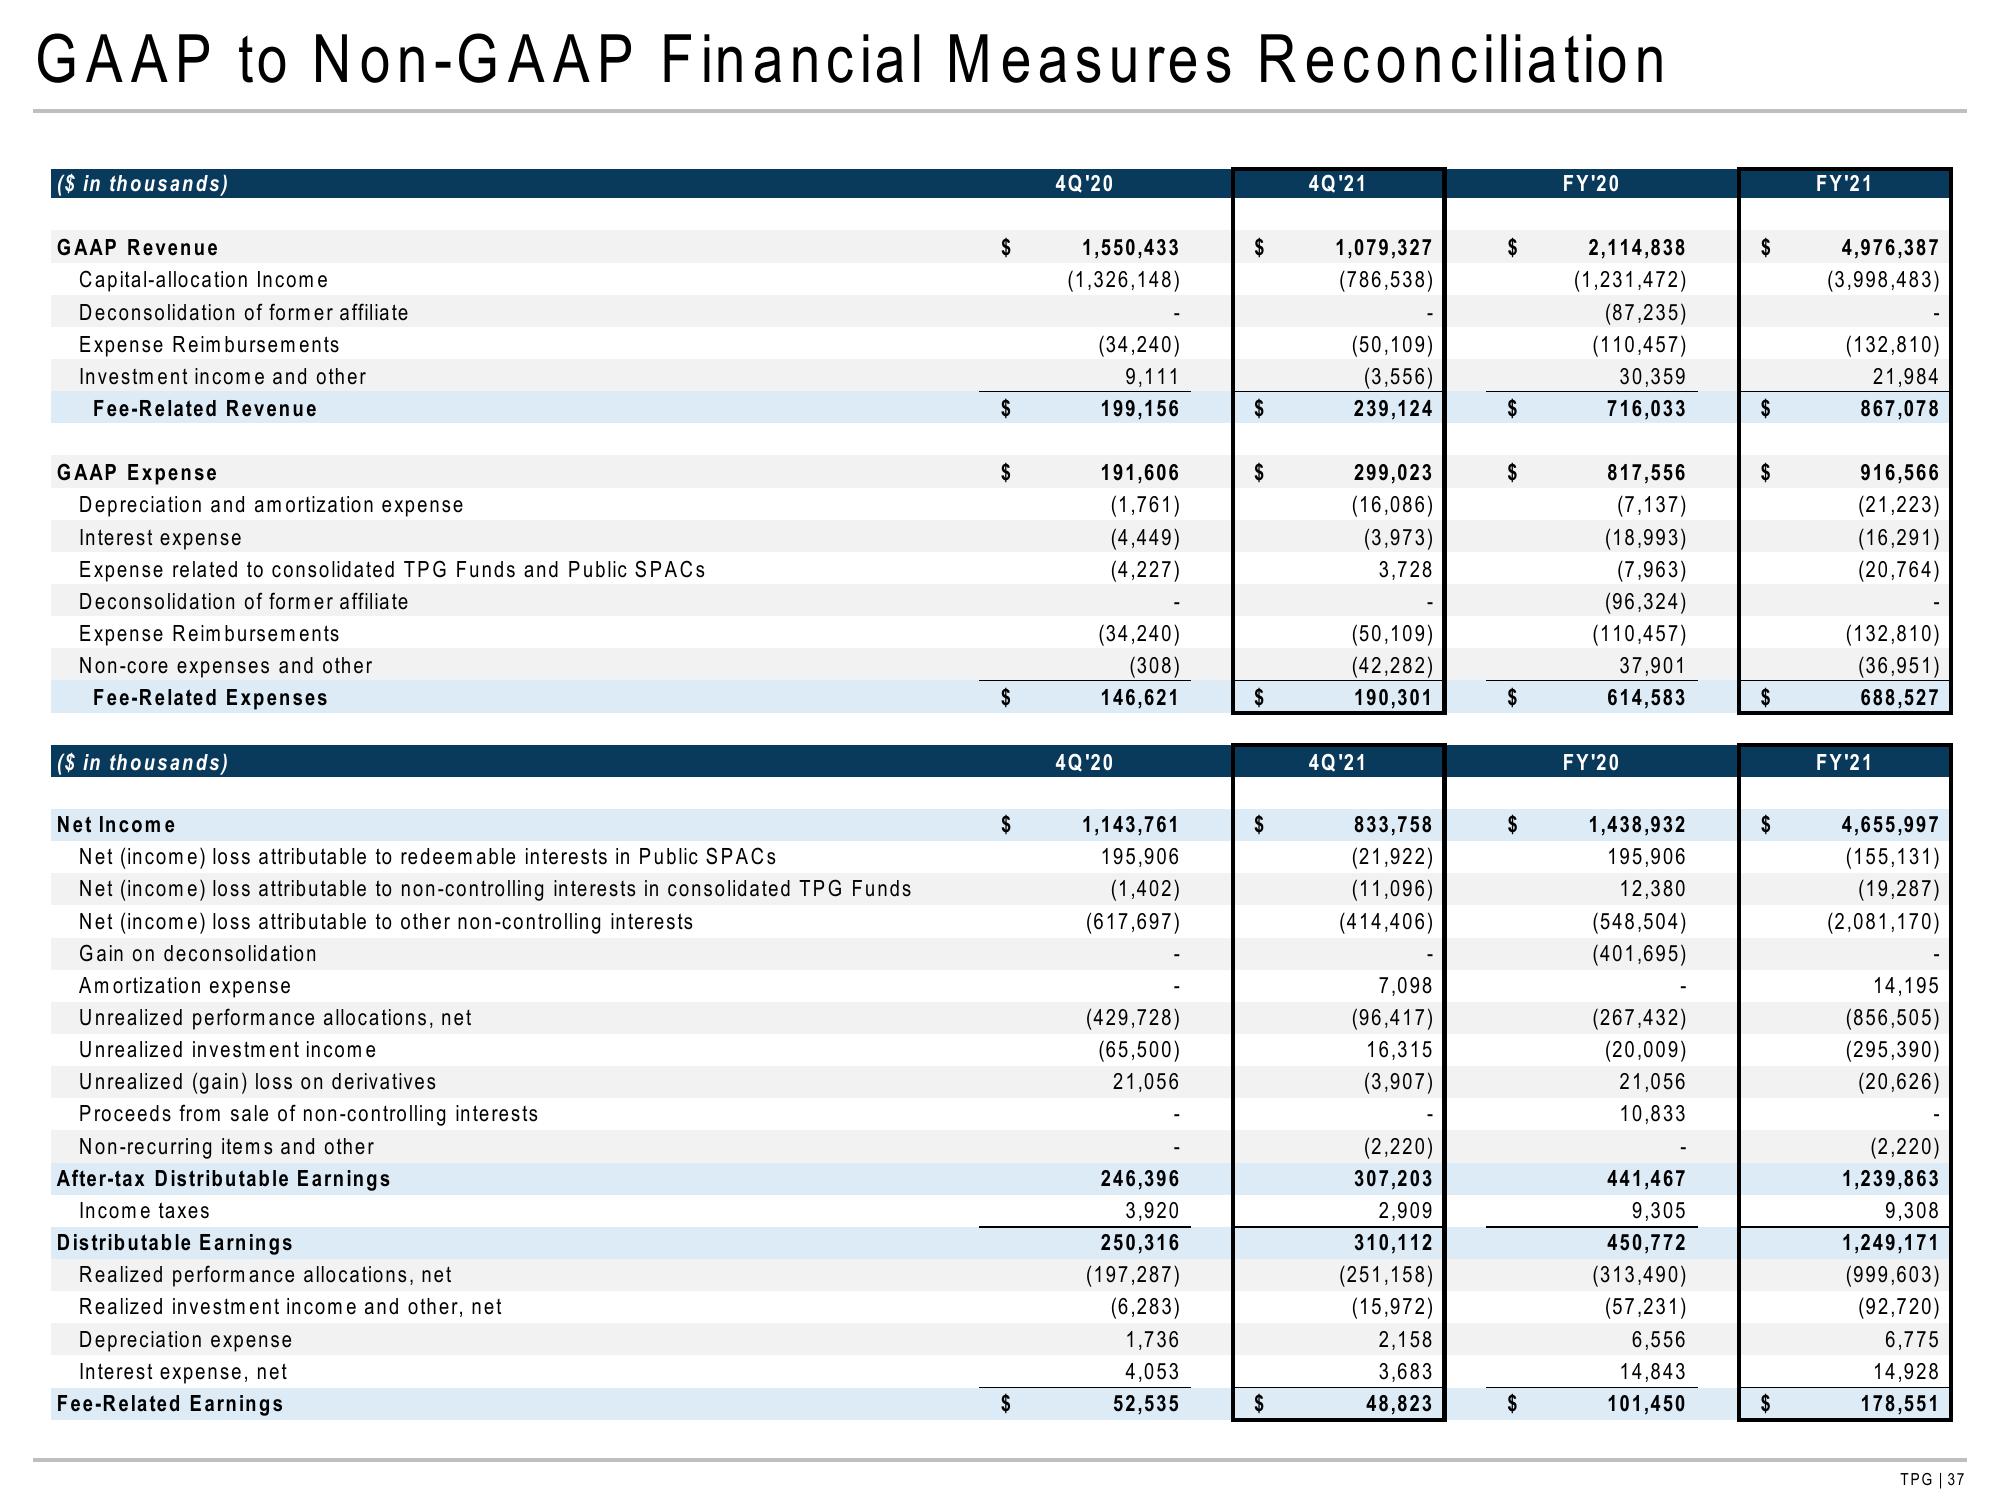
GAAP to Non-GAAP Financial Measures Reconciliation
($ in thousands)
GAAP Revenue
Capital-allocation Income
Deconsolidation of former affiliate
Expense Reimbursements
Investment income and other
Fee-Related Revenue
GAAP Expense
Depreciation and amortization expense
Interest expense
Expense related to consolidated TPG Funds and Public SPACs
Deconsolidation of former affiliate
Expense Reimbursements
Non-core expenses and other
Fee-Related Expenses
($ in thousands)
Net Income
Net (income) loss attributable to redeemable interests in Public SPACs
Net (income) loss attributable to non-controlling interests in consolidated TPG Funds
Net (income) loss attributable to other non-controlling interests
Gain on deconsolidation
Amortization expense
Unrealized performance allocations, net
Unrealized investment income
Unrealized (gain) loss on derivatives
Proceeds from sale of non-controlling interests
Non-recurring items and other
After-tax Distributable Earnings
Income taxes
Distributable Earnings
Realized performance allocations, net
Realized investment income and other, net
Depreciation expense
Interest expense, net
Fee-Related Earnings
$
$
$
$
$
4Q'20
1,550,433
(1,326,148)
(34,240)
9,111
199,156
191,606
(1,761)
(4,449)
(4,227)
(34,240)
(308)
146,621
4Q'20
1,143,761
195,906
(1,402)
(617,697)
(429,728)
(65,500)
21,056
246,396
3,920
250,316
(197,287)
(6,283)
1,736
4,053
52,535
$
$
$
$
$
$
4Q'21
1,079,327
(786,538)
(50,109)
(3,556)
239,124
299,023
(16,086)
(3,973)
3,728
(50,109)
(42,282)
190,301
4Q'21
833,758
(21,922)
(11,096)
(414,406)
7,098
(96,417)
16,315
(3,907)
(2,220)
307,203
2,909
310,112
(251,158)
(15,972)
2,158
3,683
48,823
$
$
$
$
$
FY'20
2,114,838
(1,231,472)
(87,235)
(110,457)
30,359
716,033
817,556
(7,137)
(18,993)
(7,963)
(96,324)
(110,457)
37,901
614,583
FY'20
1,438,932
195,906
12,380
(548,504)
(401,695)
(267,432)
(20,009)
21,056
10,833
441,467
9,305
450,772
(313,490)
(57,231)
6,556
14,843
101,450
$
$
$
$
$
FY'21
4,976,387
(3,998,483)
(132,810)
21,984
867,078
916,566
(21,223)
(16,291)
(20,764)
(132,810)
(36,951)
688,527
FY'21
4,655,997
(155,131)
(19,287)
(2,081,170)
14,195
(856,505)
(295,390)
(20,626)
(2,220)
1,239,863
9,308
1,249,171
(999,603)
(92,720)
6,775
14,928
178,551
TPG | 37View entire presentation