Disney Results Presentation Deck
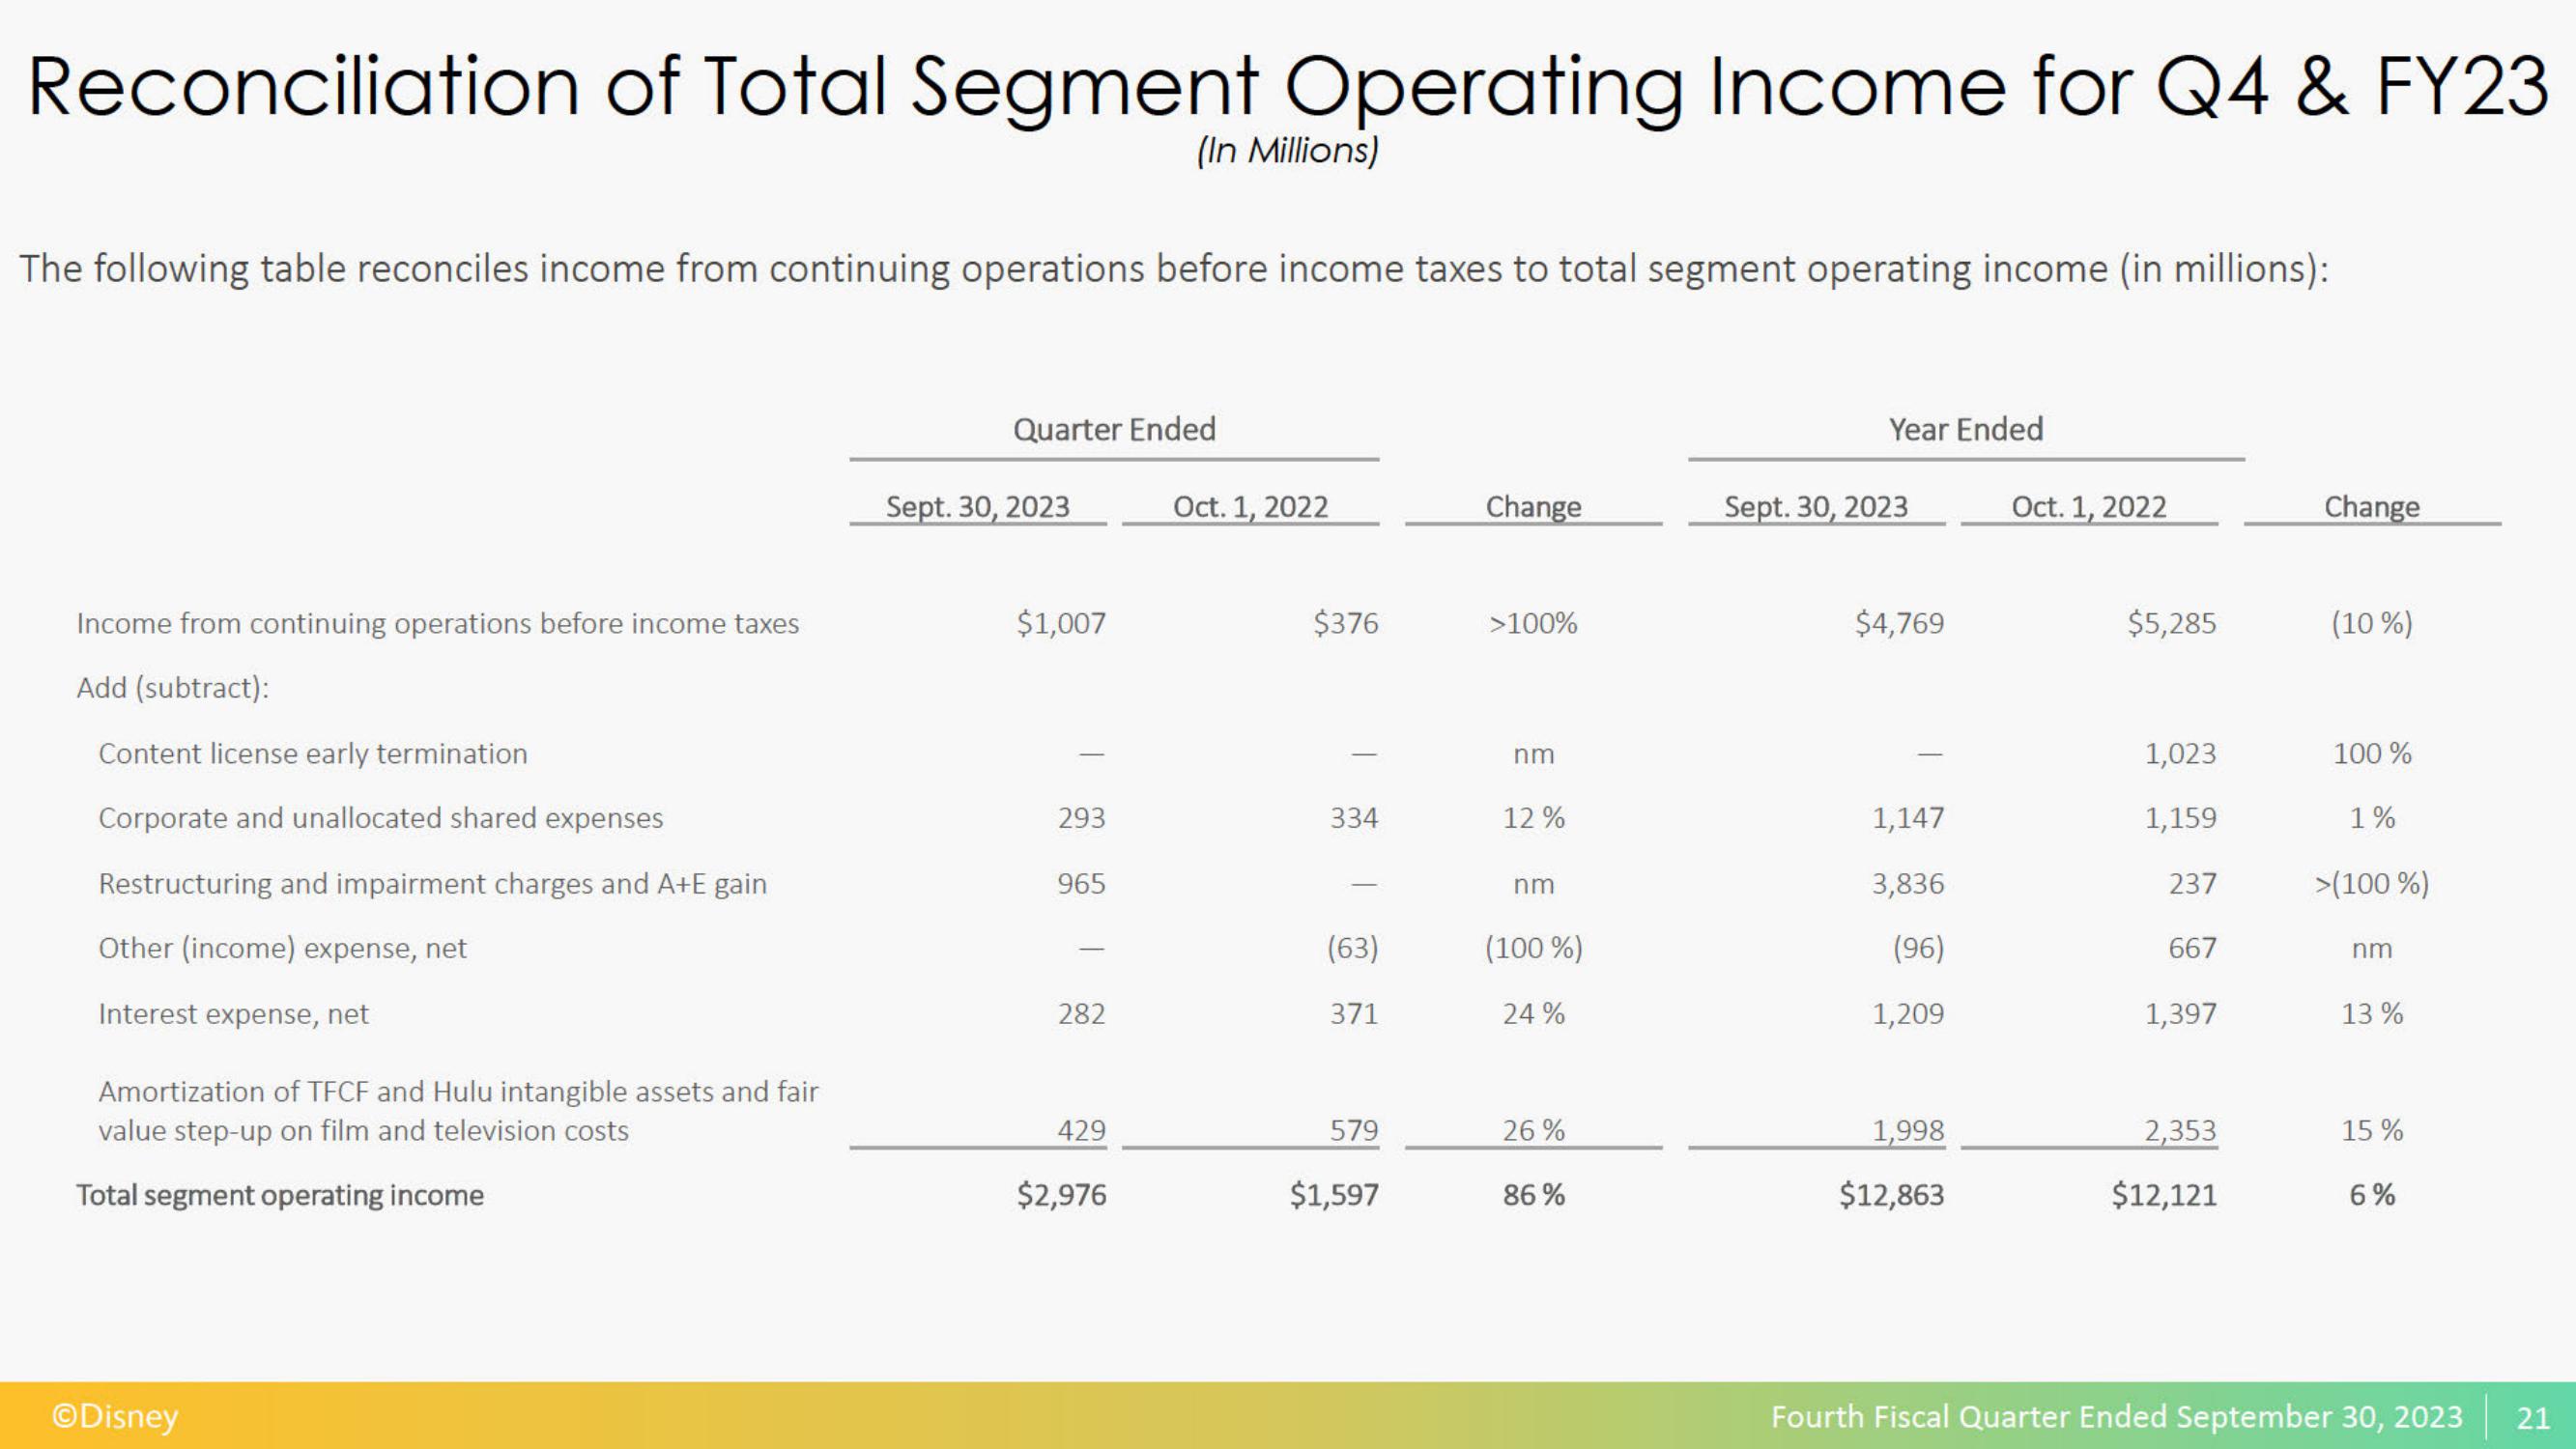
Reconciliation of Total Segment Operating Income for Q4 & FY23
The following table reconciles income from continuing operations before income taxes to total segment operating income (in millions):
Income from continuing operations before income taxes
Add (subtract):
Content license early termination
Corporate and unallocated shared expenses
Restructuring and impairment charges and A+E gain
Other (income) expense, net
Interest expense, net
Amortization of TFCF and Hulu intangible assets and fair
value step-up on film and television costs
Total segment operating income
ⒸDisney
Quarter Ended
Sept. 30, 2023
$1,007
293
965
282
(In Millions)
429
$2,976
Oct. 1, 2022
$376
334
(63)
371
579
$1,597
Change
>100%
nm
12%
nm
(100 %)
24%
26%
86%
Year Ended
Sept. 30, 2023
$4,769
1,147
3,836
(96)
1,209
1,998
$12,863
Oct. 1, 2022
$5,285
1,023
1,159
237
667
1,397
2,353
$12,121
Change
(10 %)
100 %
1%
>(100 %)
nm
13%
15 %
6%
Fourth Fiscal Quarter Ended September 30, 2023
21View entire presentation