Synchrony Financial Results Presentation Deck
Funding, Capital and Liquidity
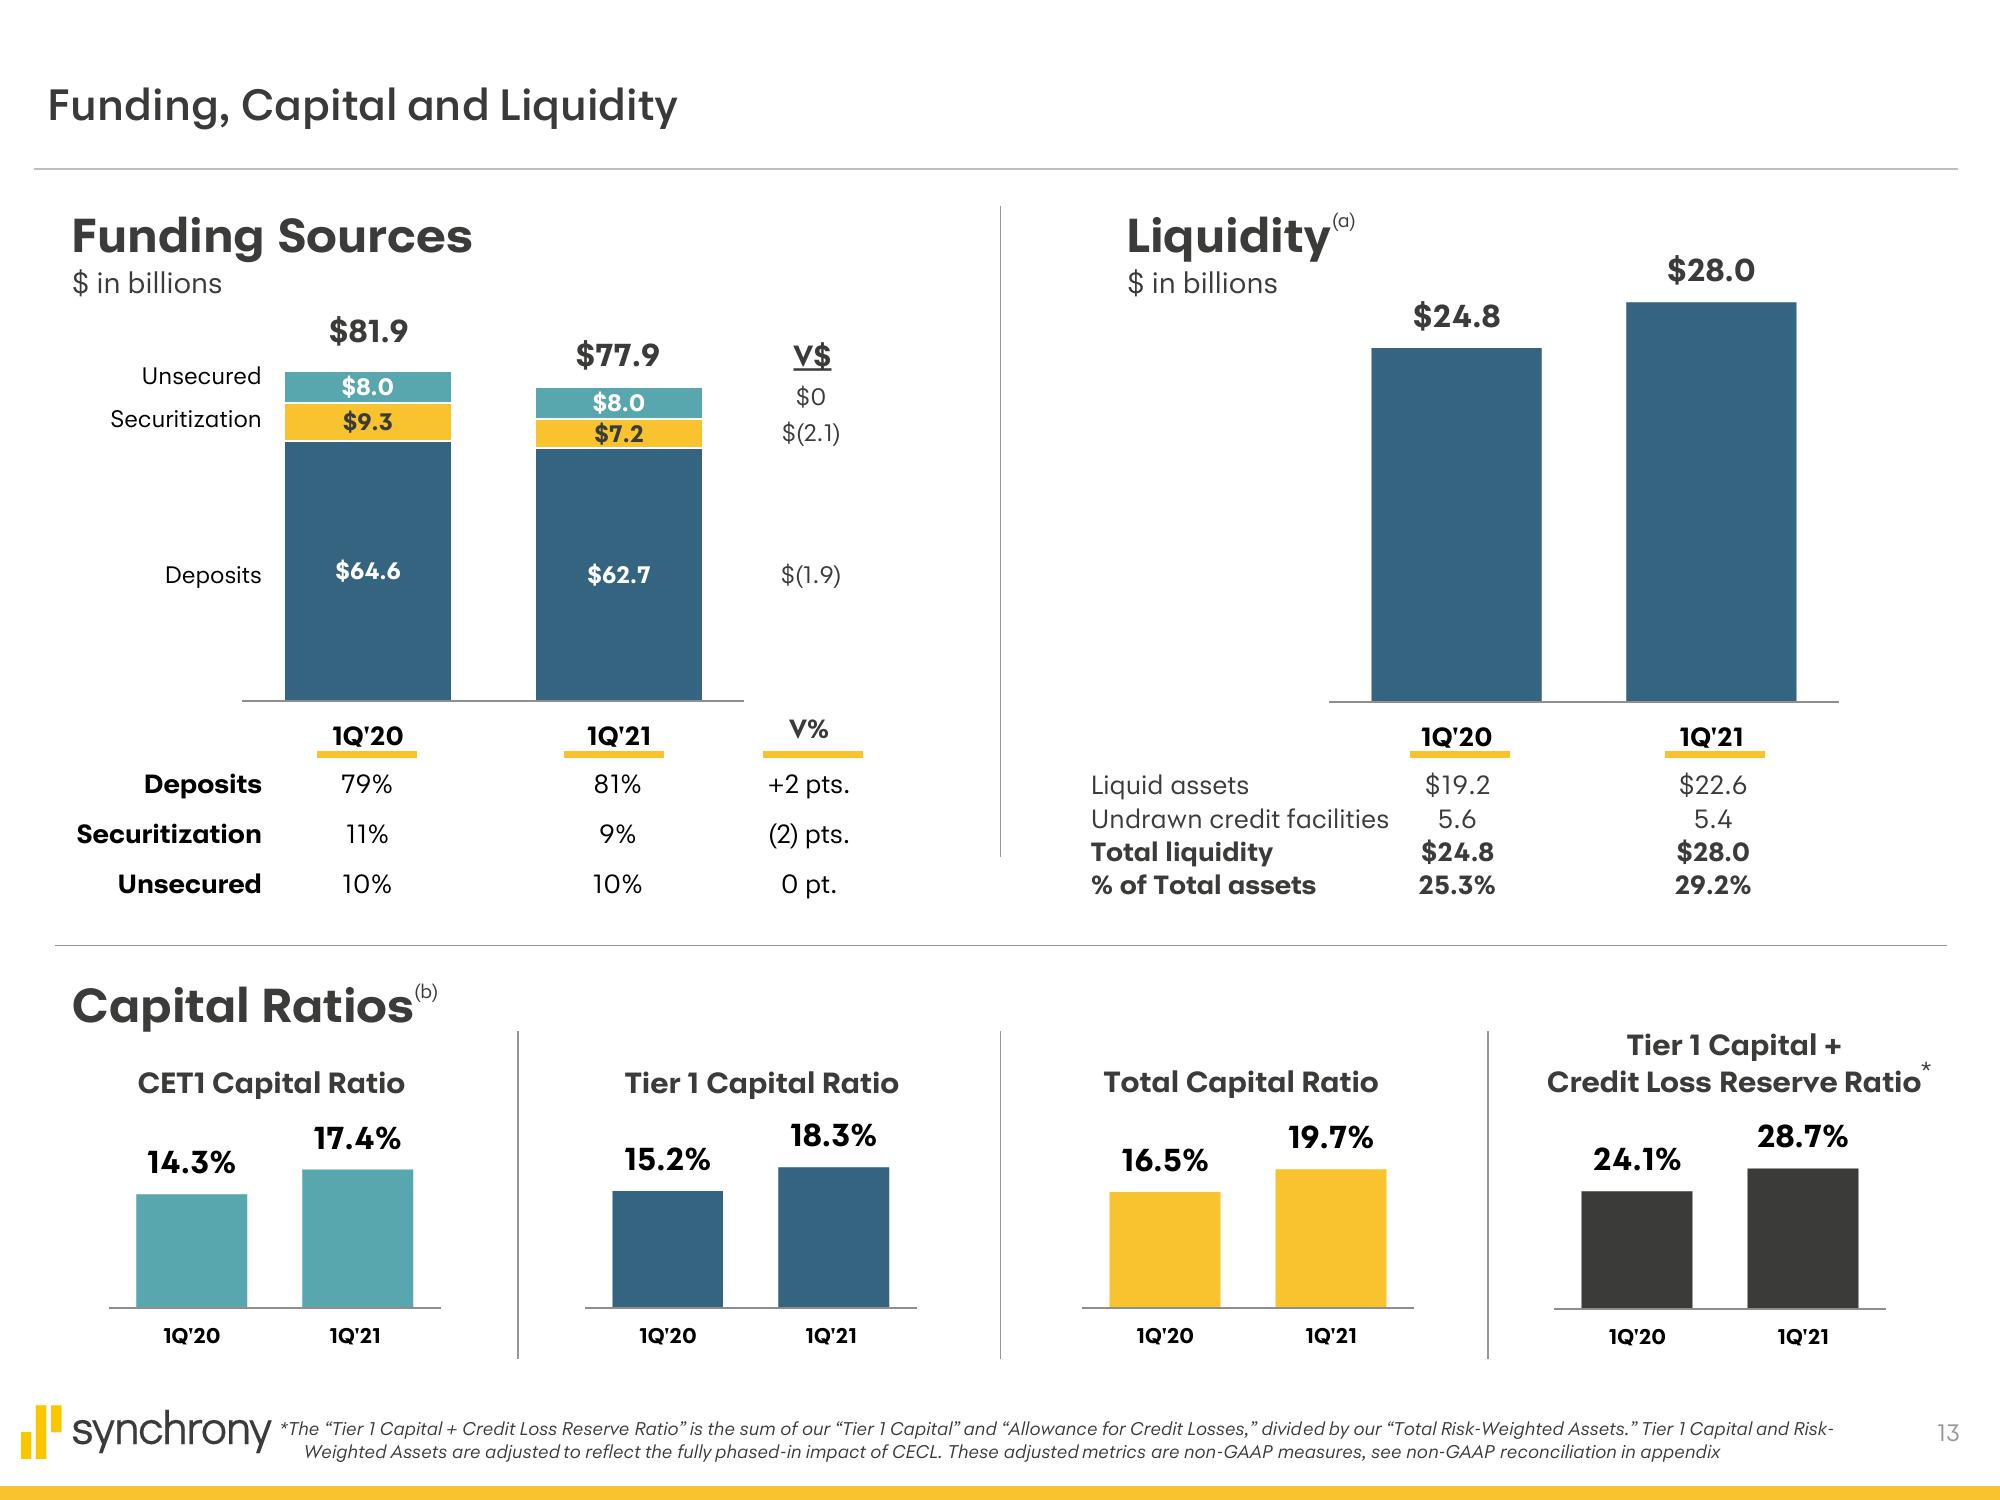
Funding Sources
$ in billions
Unsecured
Securitization
Deposits
Deposits
Securitization
Unsecured
14.3%
1Q'20
$81.9
$8.0
$9.3
Capital Ratios
CET1 Capital Ratio
17.4%
synchrony
$64.6
1Q'20
79%
11%
10%
1Q'21
$77.9
$8.0
$7.2
$62.7
1Q'21
81%
9%
10%
15.2%
V$
$0
$(2.1)
1Q'20
$(1.9)
V%
Tier 1 Capital Ratio
18.3%
+2 pts.
(2) pts.
0 pt.
1Q'21
Liquidity)
$ in billions
Liquid assets
Undrawn credit facilities
Total liquidity
% of Total assets
Total Capital Ratio
19.7%
16.5%
1Q'20
1Q'21
$24.8
1Q'20
$19.2
5.6
$24.8
25.3%
$28.0
1Q'21
$22.6
5.4
$28.0
29.2%
Tier 1 Capital +
Credit Loss Reserve Ratio
28.7%
1Q'20
24.1%
1Q'21
*The "Tier 1 Capital + Credit Loss Reserve Ratio" is the sum of our "Tier 1 Capital" and "Allowance for Credit Losses," divided by our "Total Risk-Weighted Assets." Tier 1 Capital and Risk-
Weighted Assets are adjusted to reflect the fully phased-in impact of CECL. These adjusted metrics are non-GAAP measures, see non-GAAP reconciliation in appendix
*
13View entire presentation