Squarespace Investor Day Presentation Deck
INVESTOR DAY
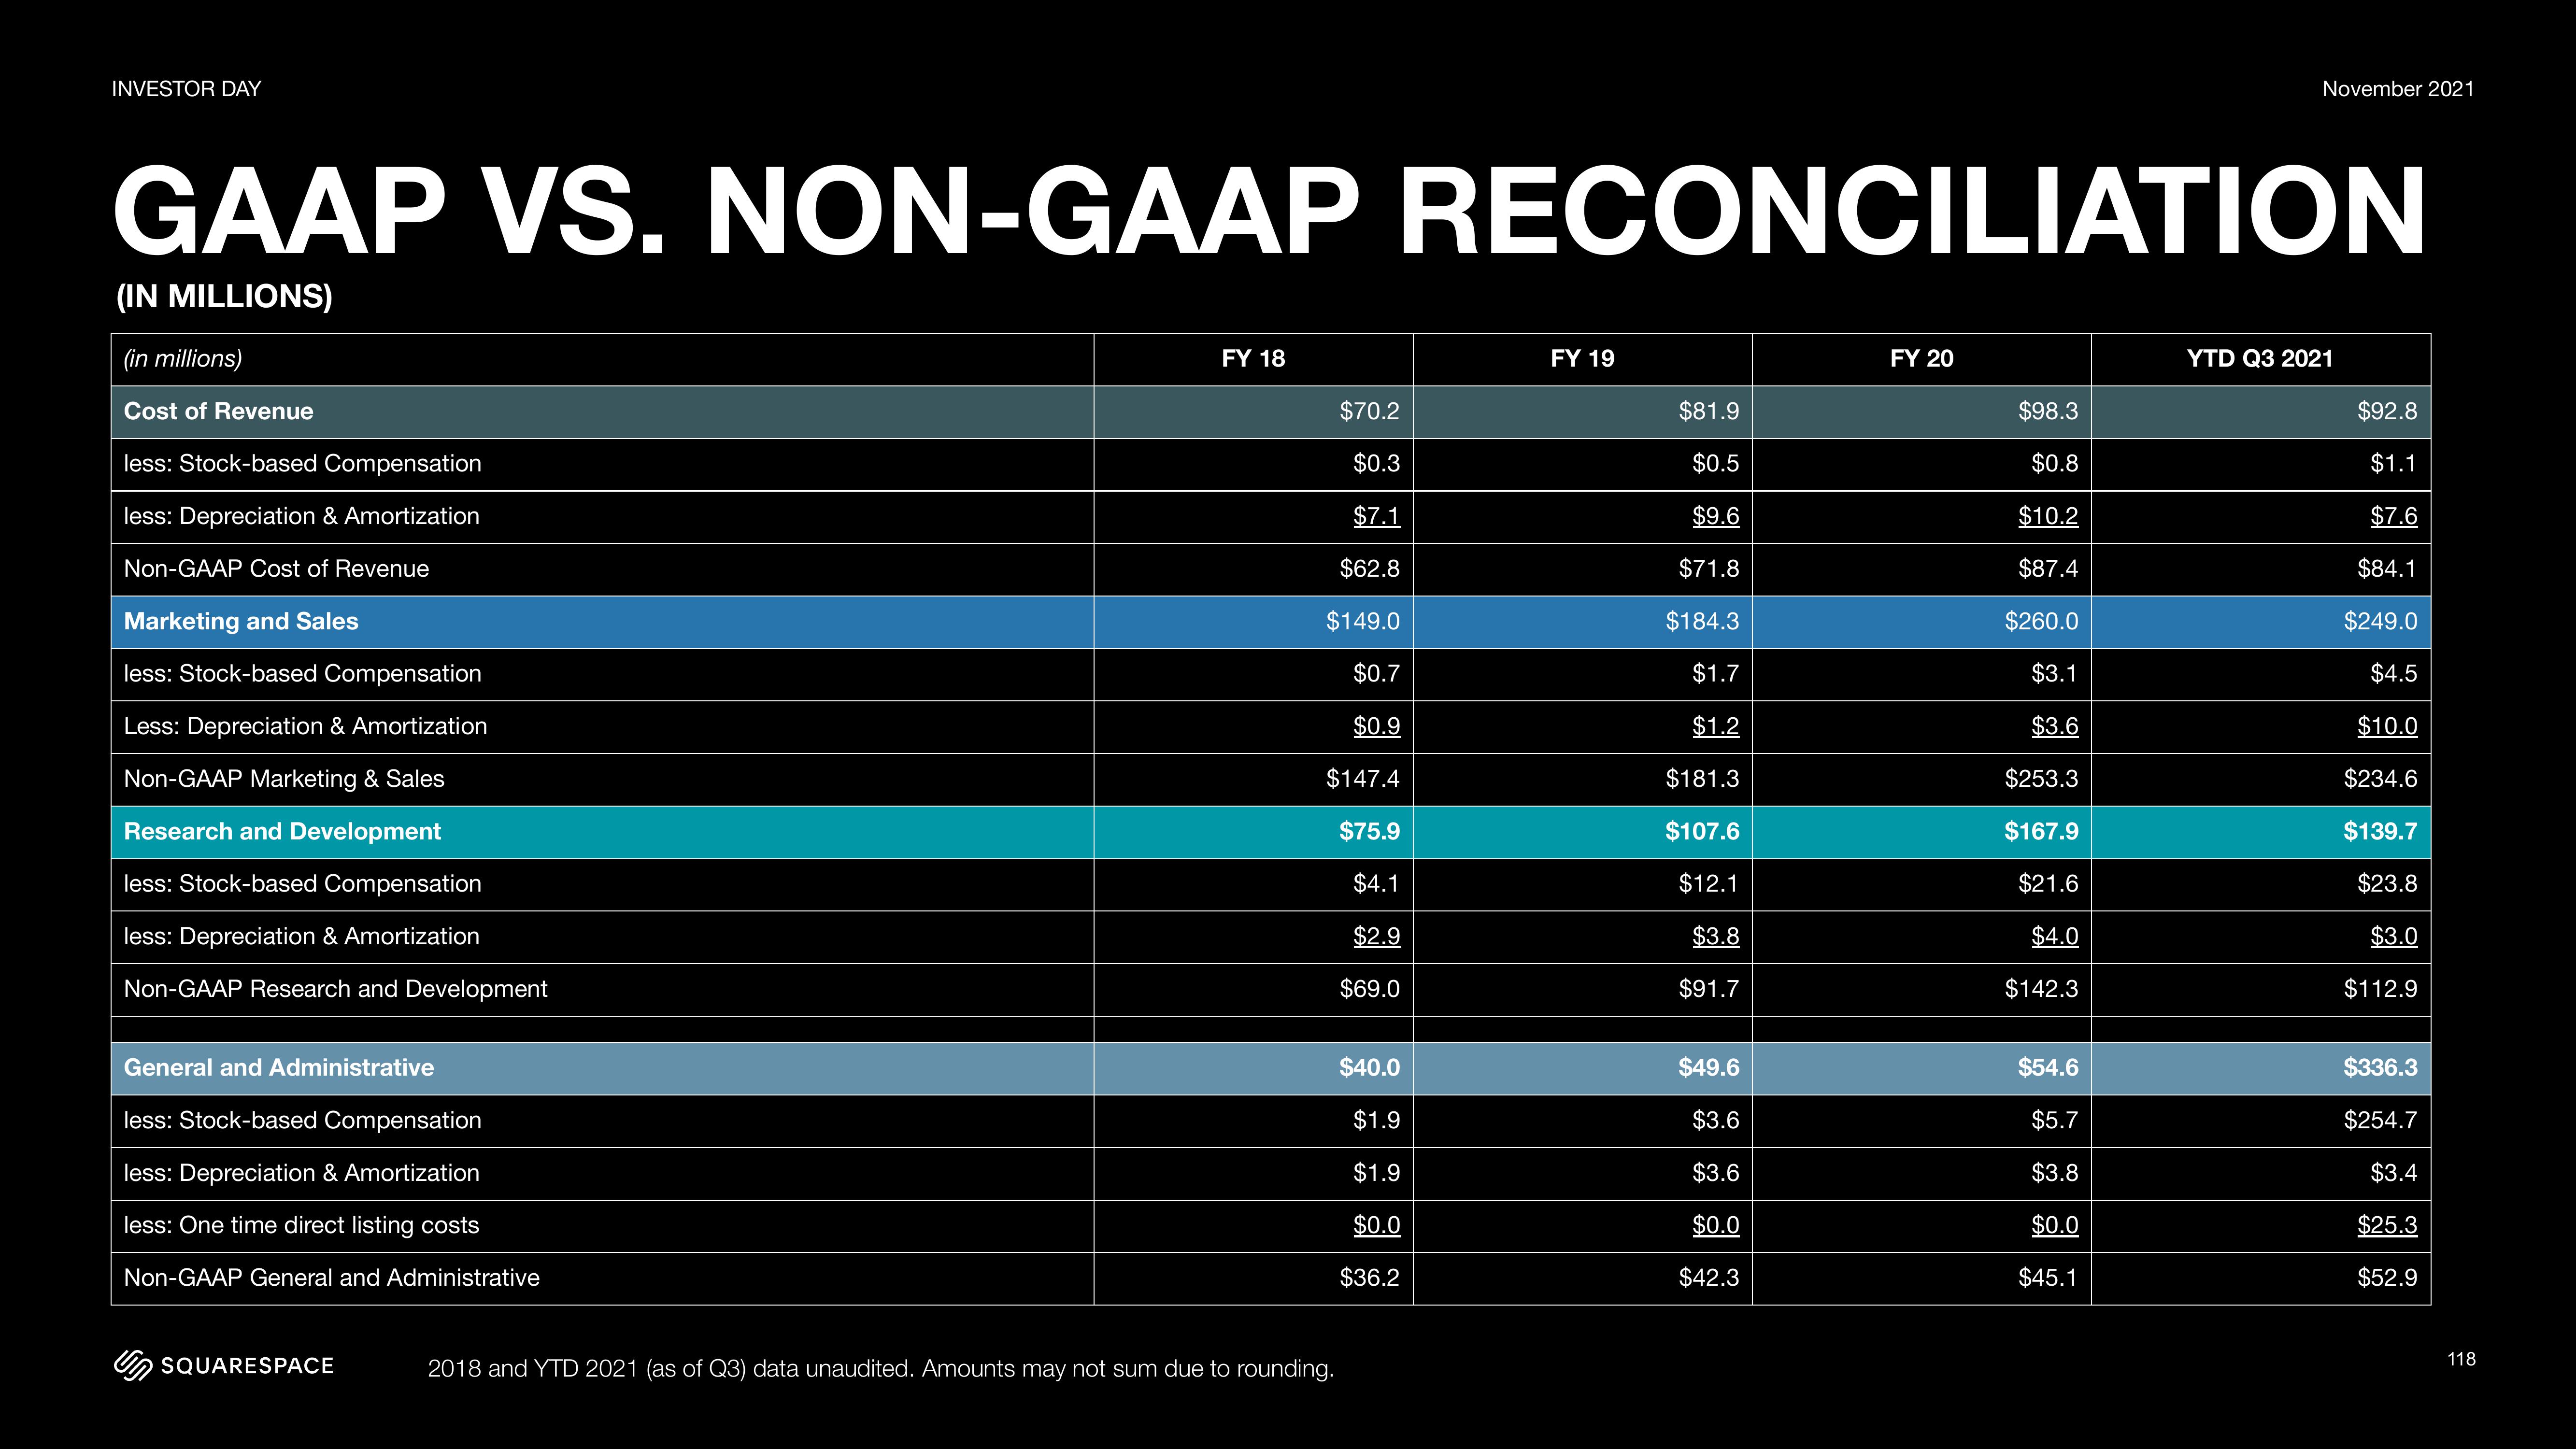
GAAP VS. NON-GAAP RECONCILIATION
(IN MILLIONS)
(in millions)
Cost of Revenue
less: Stock-based Compensation
less: Depreciation & Amortization
Non-GAAP Cost of Revenue
Marketing and Sales
less: Stock-based Compensation
Less: Depreciation & Amortization
Non-GAAP Marketing & Sales
Research and Development
less: Stock-based Compensation
less: Depreciation & Amortization
Non-GAAP Research and Development
General and Administrative
less: Stock-based Compensation
less: Depreciation & Amortization
less: One time direct listing costs
Non-GAAP General and Administrative
SQUARESPACE
FY 18
$70.2
$0.3
$7.1
$62.8
$149.0
$0.7
$0.9
$147.4
$75.9
$4.1
$2.9
$69.0
2018 and YTD 2021 (as of Q3) data unaudited. Amounts may not sum due to rounding.
$40.0
$1.9
$1.9
$0.0
$36.2
FY 19
$81.9
$0.5
$9.6
$71.8
$184.3
$1.7
$1.2
$181.3
$107.6
$12.1
$3.8
$91.7
$49.6
$3.6
$3.6
$0.0
$42.3
FY 20
$98.3
$0.8
$10.2
$87.4
$260.0
$3.1
$3.6
$253.3
$167.9
$21.6
$4.0
$142.3
November 2021
$54.6
$5.7
$3.8
$0.0
$45.1
YTD Q3 2021
$92.8
$1.1
$7.6
$84.1
$249.0
$4.5
$10.0
$234.6
$139.7
$23.8
$3.0
$112.9
$336.3
$254.7
$3.4
$25.3
$52.9
118View entire presentation