Wix Results Presentation Deck
2016 compared to 48% in 2015 and we continue to progress towards our
long-term target of 30%.
We are constantly optimizing our channel and geographic mix to drive faster
return on our marketing dollars. In Q3, we maintained our marketing efficiency
while still growing our investment 36% year over year, a significant
achievement. Our ability to increase our global marketing efforts while
remaining within our TROI target range is a testament to the increasing
efficiency of our direct response advertising, increased brand awareness and
the continued improvement in our product.
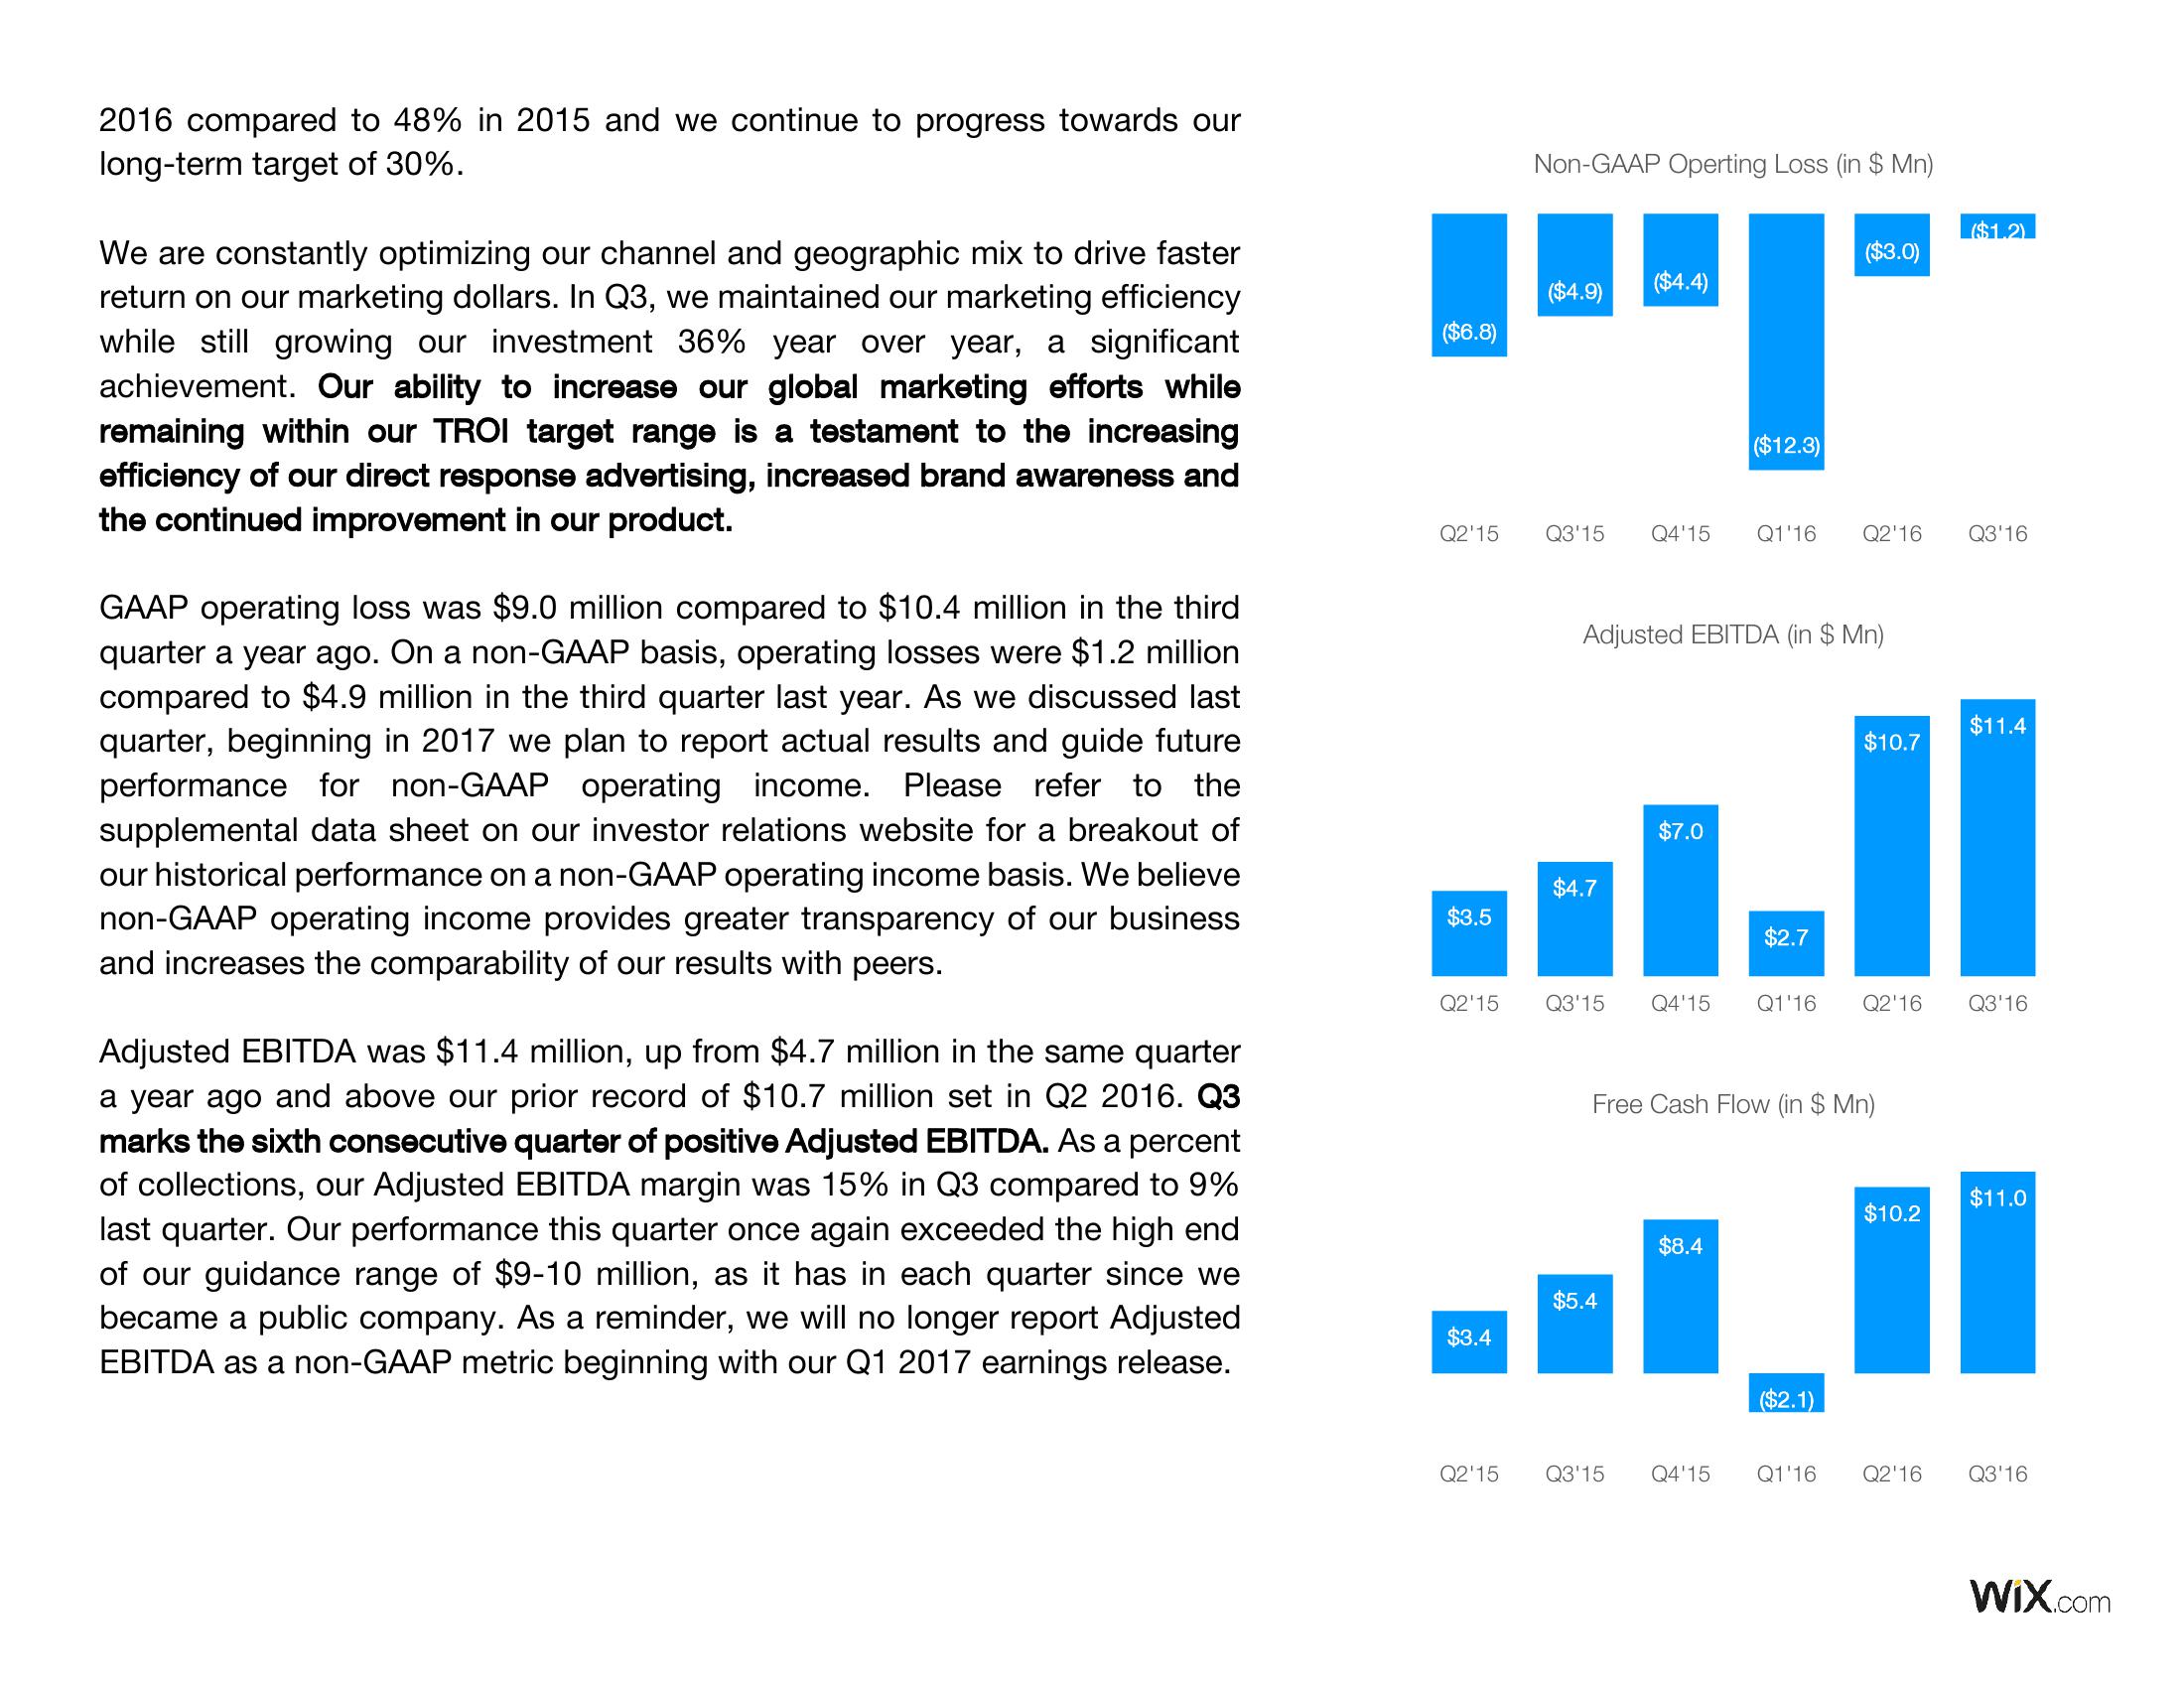
GAAP operating loss was $9.0 million compared to $10.4 million in the third
quarter a year ago. On a non-GAAP basis, operating losses were $1.2 million
compared to $4.9 million in the third quarter last year. As we discussed last
quarter, beginning in 2017 we plan to report actual results and guide future
performance for non-GAAP operating income. Please refer to the
supplemental data sheet on our investor relations website for a breakout of
our historical performance on a non-GAAP operating income basis. We believe
non-GAAP operating income provides greater transparency of our business
and increases the comparability of our results with peers.
Adjusted EBITDA was $11.4 million, up from $4.7 million in the same quarter
a year ago and above our prior record of $10.7 million set in Q2 2016. Q3
marks the sixth consecutive quarter of positive Adjusted EBITDA. As a percent
of collections, our Adjusted EBITDA margin was 15% in Q3 compared to 9%
last quarter. Our performance this quarter once again exceeded the high end
of our guidance range of $9-10 million, as it has in each quarter since we
became a public company. As a reminder, we will no longer report Adjusted
EBITDA as a non-GAAP metric beginning with our Q1 2017 earnings release.
($6.8)
$3.5
Non-GAAP Operting Loss (in $ Mn)
Q2'15
($4.9)
$3.4
Q2'15 Q3'15 Q4'15 Q1'16 Q2'16
($4.4)
($12.3)
Adjusted EBITDA (in $ Mn)
$7.0
..ll
$4.7
$2.7
Q3'15 Q4'15 Q1'16 Q2'16 Q3'16
$5.4
($3.0)
$8.4
Free Cash Flow (in $ Mn)
($2.1)
$10.7
$10.2
($1.2)
Q2'15 Q3'15 Q4'15 Q1'16 Q2'16
Q3'16
$11.4
$11.0
Q3'16
Wix.comView entire presentation