Plastiq SPAC Presentation Deck
2022E
2023E
2022E
2023E
6.5x 4.6x
Revenue CAGR
2021e-2023E 49%
Revenue multiples
2022E
2023E
IQ
plastiq
6.5x
4.6x
0.13x
0.09x
18.1x
Market data as of 7/1/22
Source: S&P Capital IQ
18.1x
13.2x
Growth-adjusted revenue multiples
0.31x
0.23x
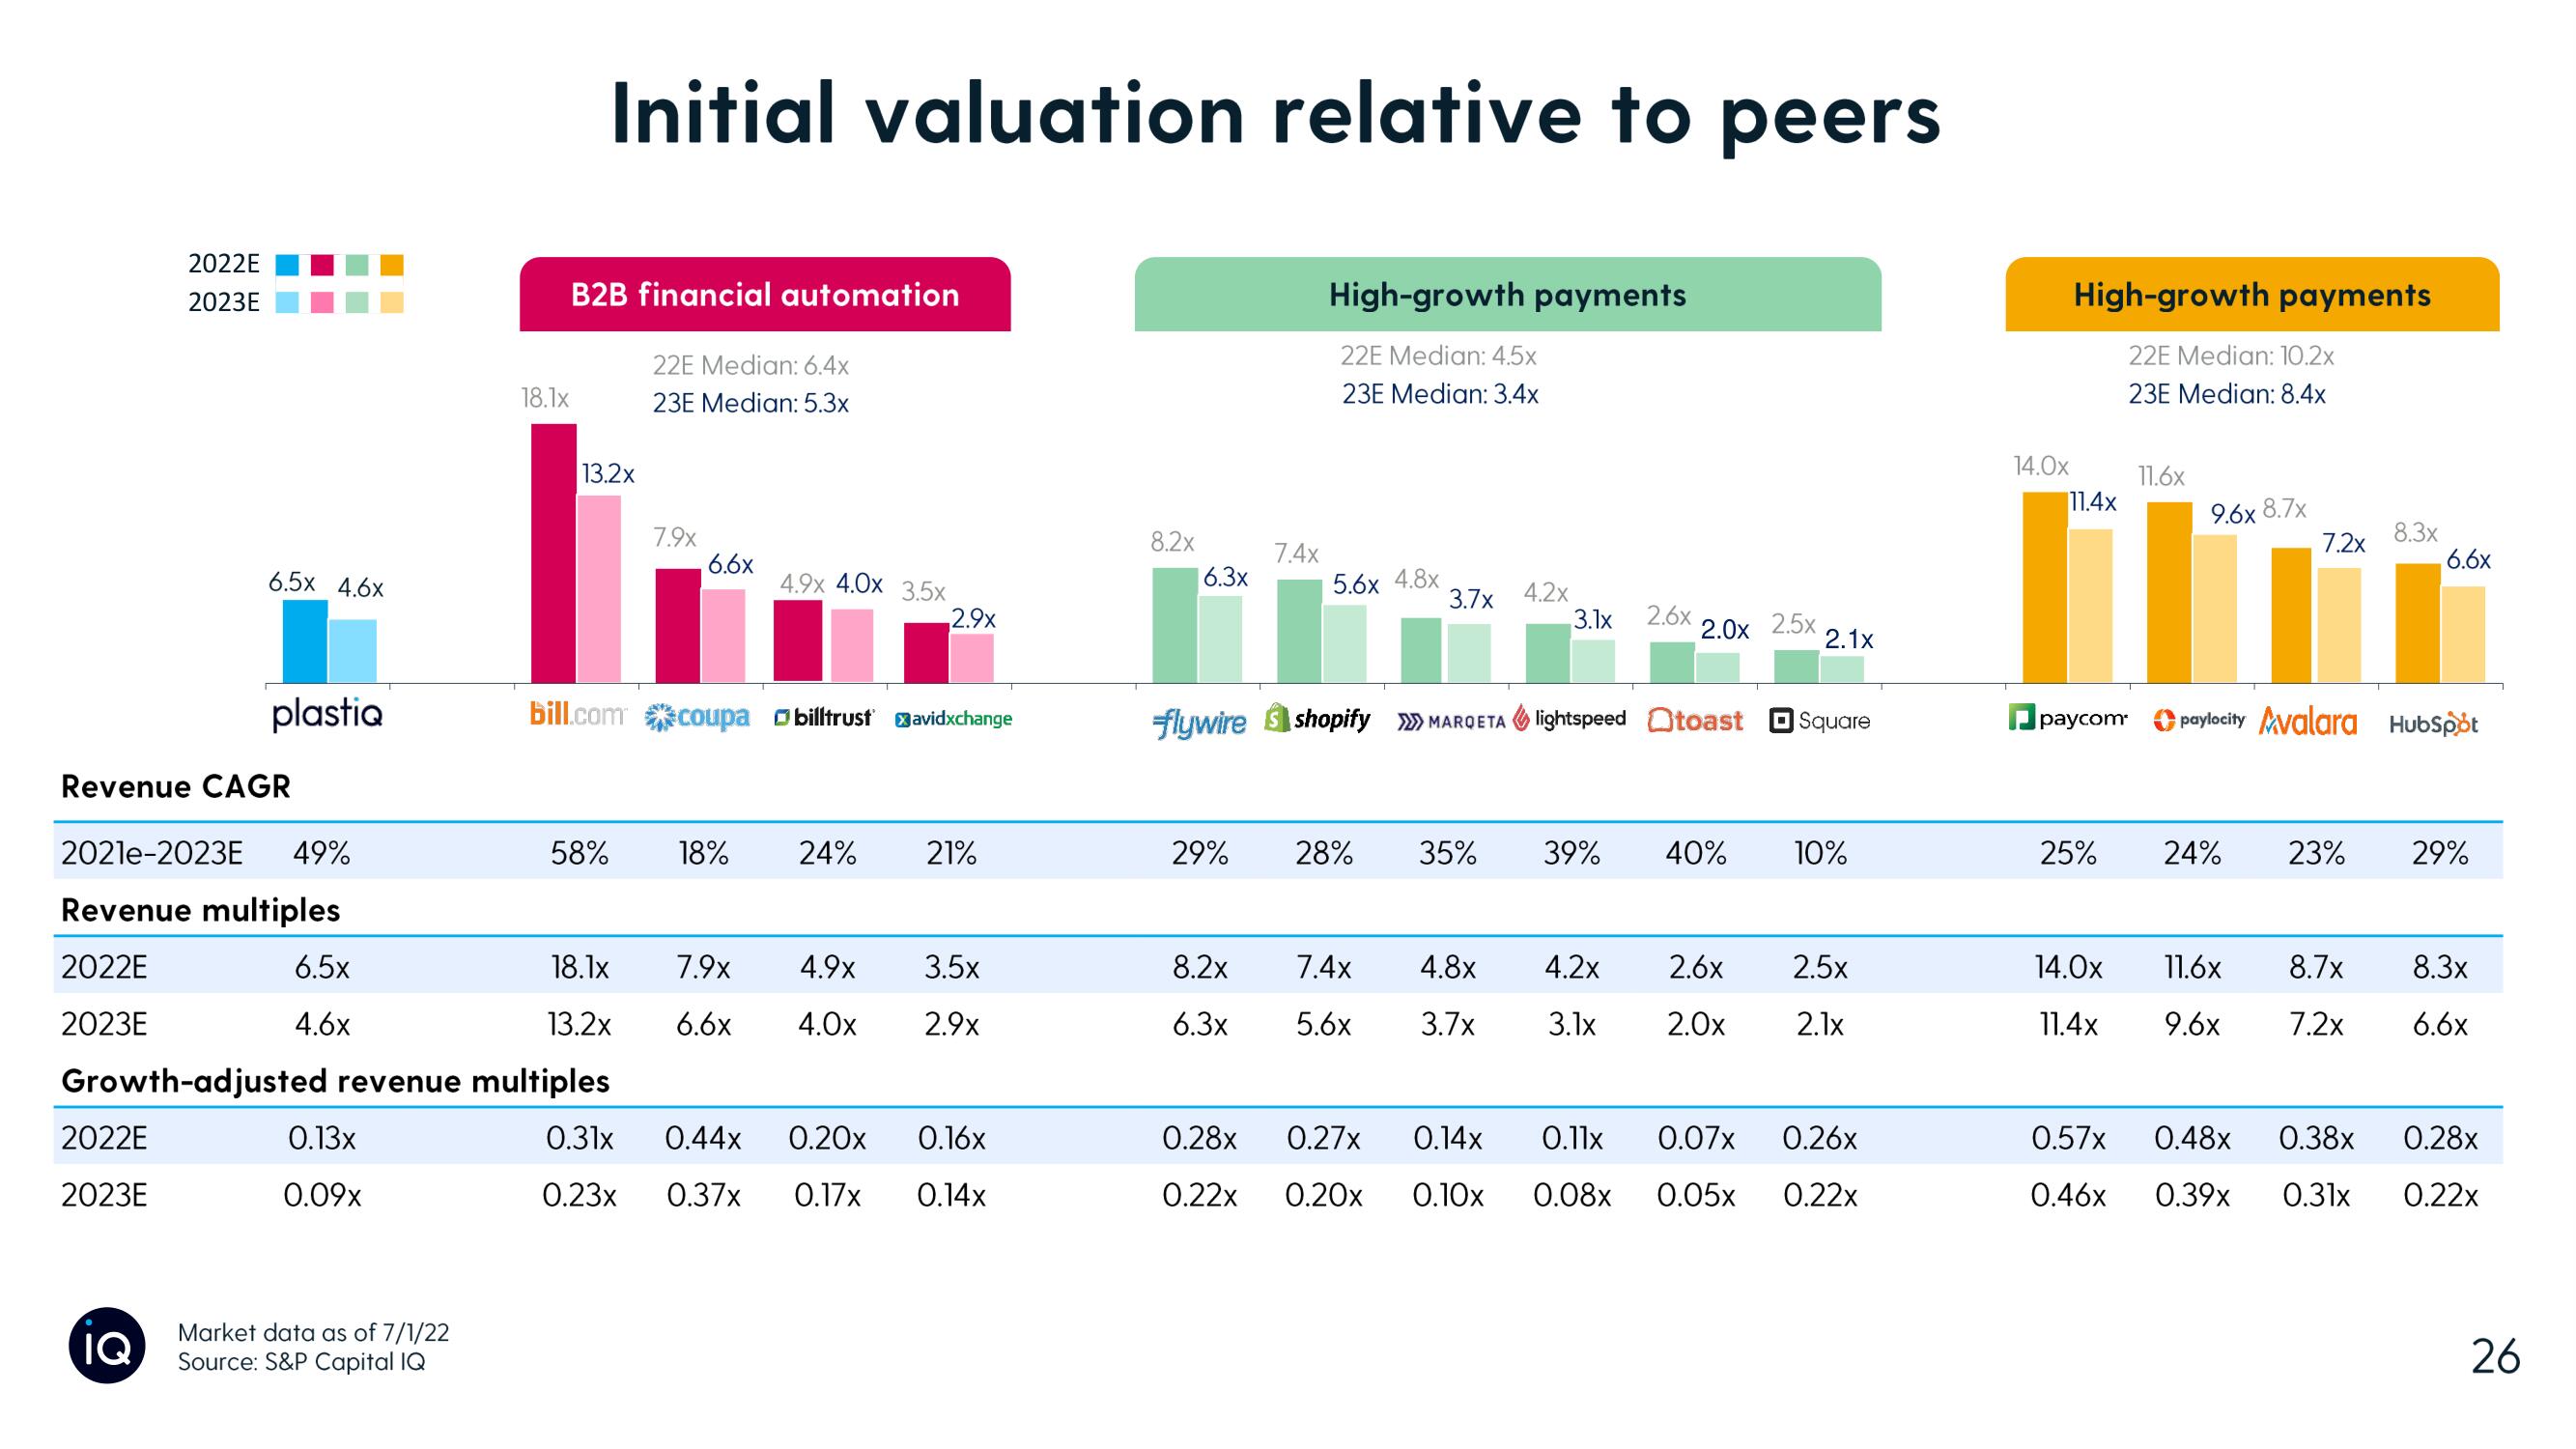
Initial valuation relative to peers
B2B financial automation
13.2x
58%
22E Median: 6.4x
23E Median: 5.3x
7.9x
6.6x
4.9x 4.0x 3.5x
bill.com coupa billtrust avidxchange
2.9x
18% 24% 21%
7.9x 4.9x 3.5x
6.6x 4.0x 2.9x
0.44x 0.20x
0.37x 0.17x
0.16x
0.14x
8.2x
6.3x
flywire
7.4x
High-growth payments
22E Median: 4.5x
23E Median: 3.4x
5.6x 4.8x
3.7x 4.2x
3.1x 2.6x
29% 28% 35% 39%
shopify MARQETA lightspeed toast Square
8.2x 7.4x 4.8x 4.2x
6.3x 5.6x 3.7x 3.1x
2.0x 2.5x
0.28x 0.27x 0.14x 0.11x
0.22x 0.20x 0.10x 0.08x
40%
2.6x
2.0x
2.1x
0.07x
0.05x
10%
2.5x
2.1x
0.26x
0.22x
14.0x
High-growth payments
22E Median: 10.2x
23E Median: 8.4x
11.4x
paycom*
25%
14.0x
11.4x
11.6x
9.6x 8.7x
7.2x
8.3x
24% 23%
6.6x
paylocity Avalara Hubspot
29%
11.6x 8.7x
8.3x
9.6x 7.2x 6.6x
0.57x 0.48x 0.38x 0.28x
0.46x
0.39x 0.31x 0.22x
26View entire presentation