Palantir Results Presentation Deck
O)
Q4 2020 BUSINESS UPDATE
.000
Ⓒ2021 PALANTIR TECHNOLOGIES INC.
31
Momentum 04
Figure 01
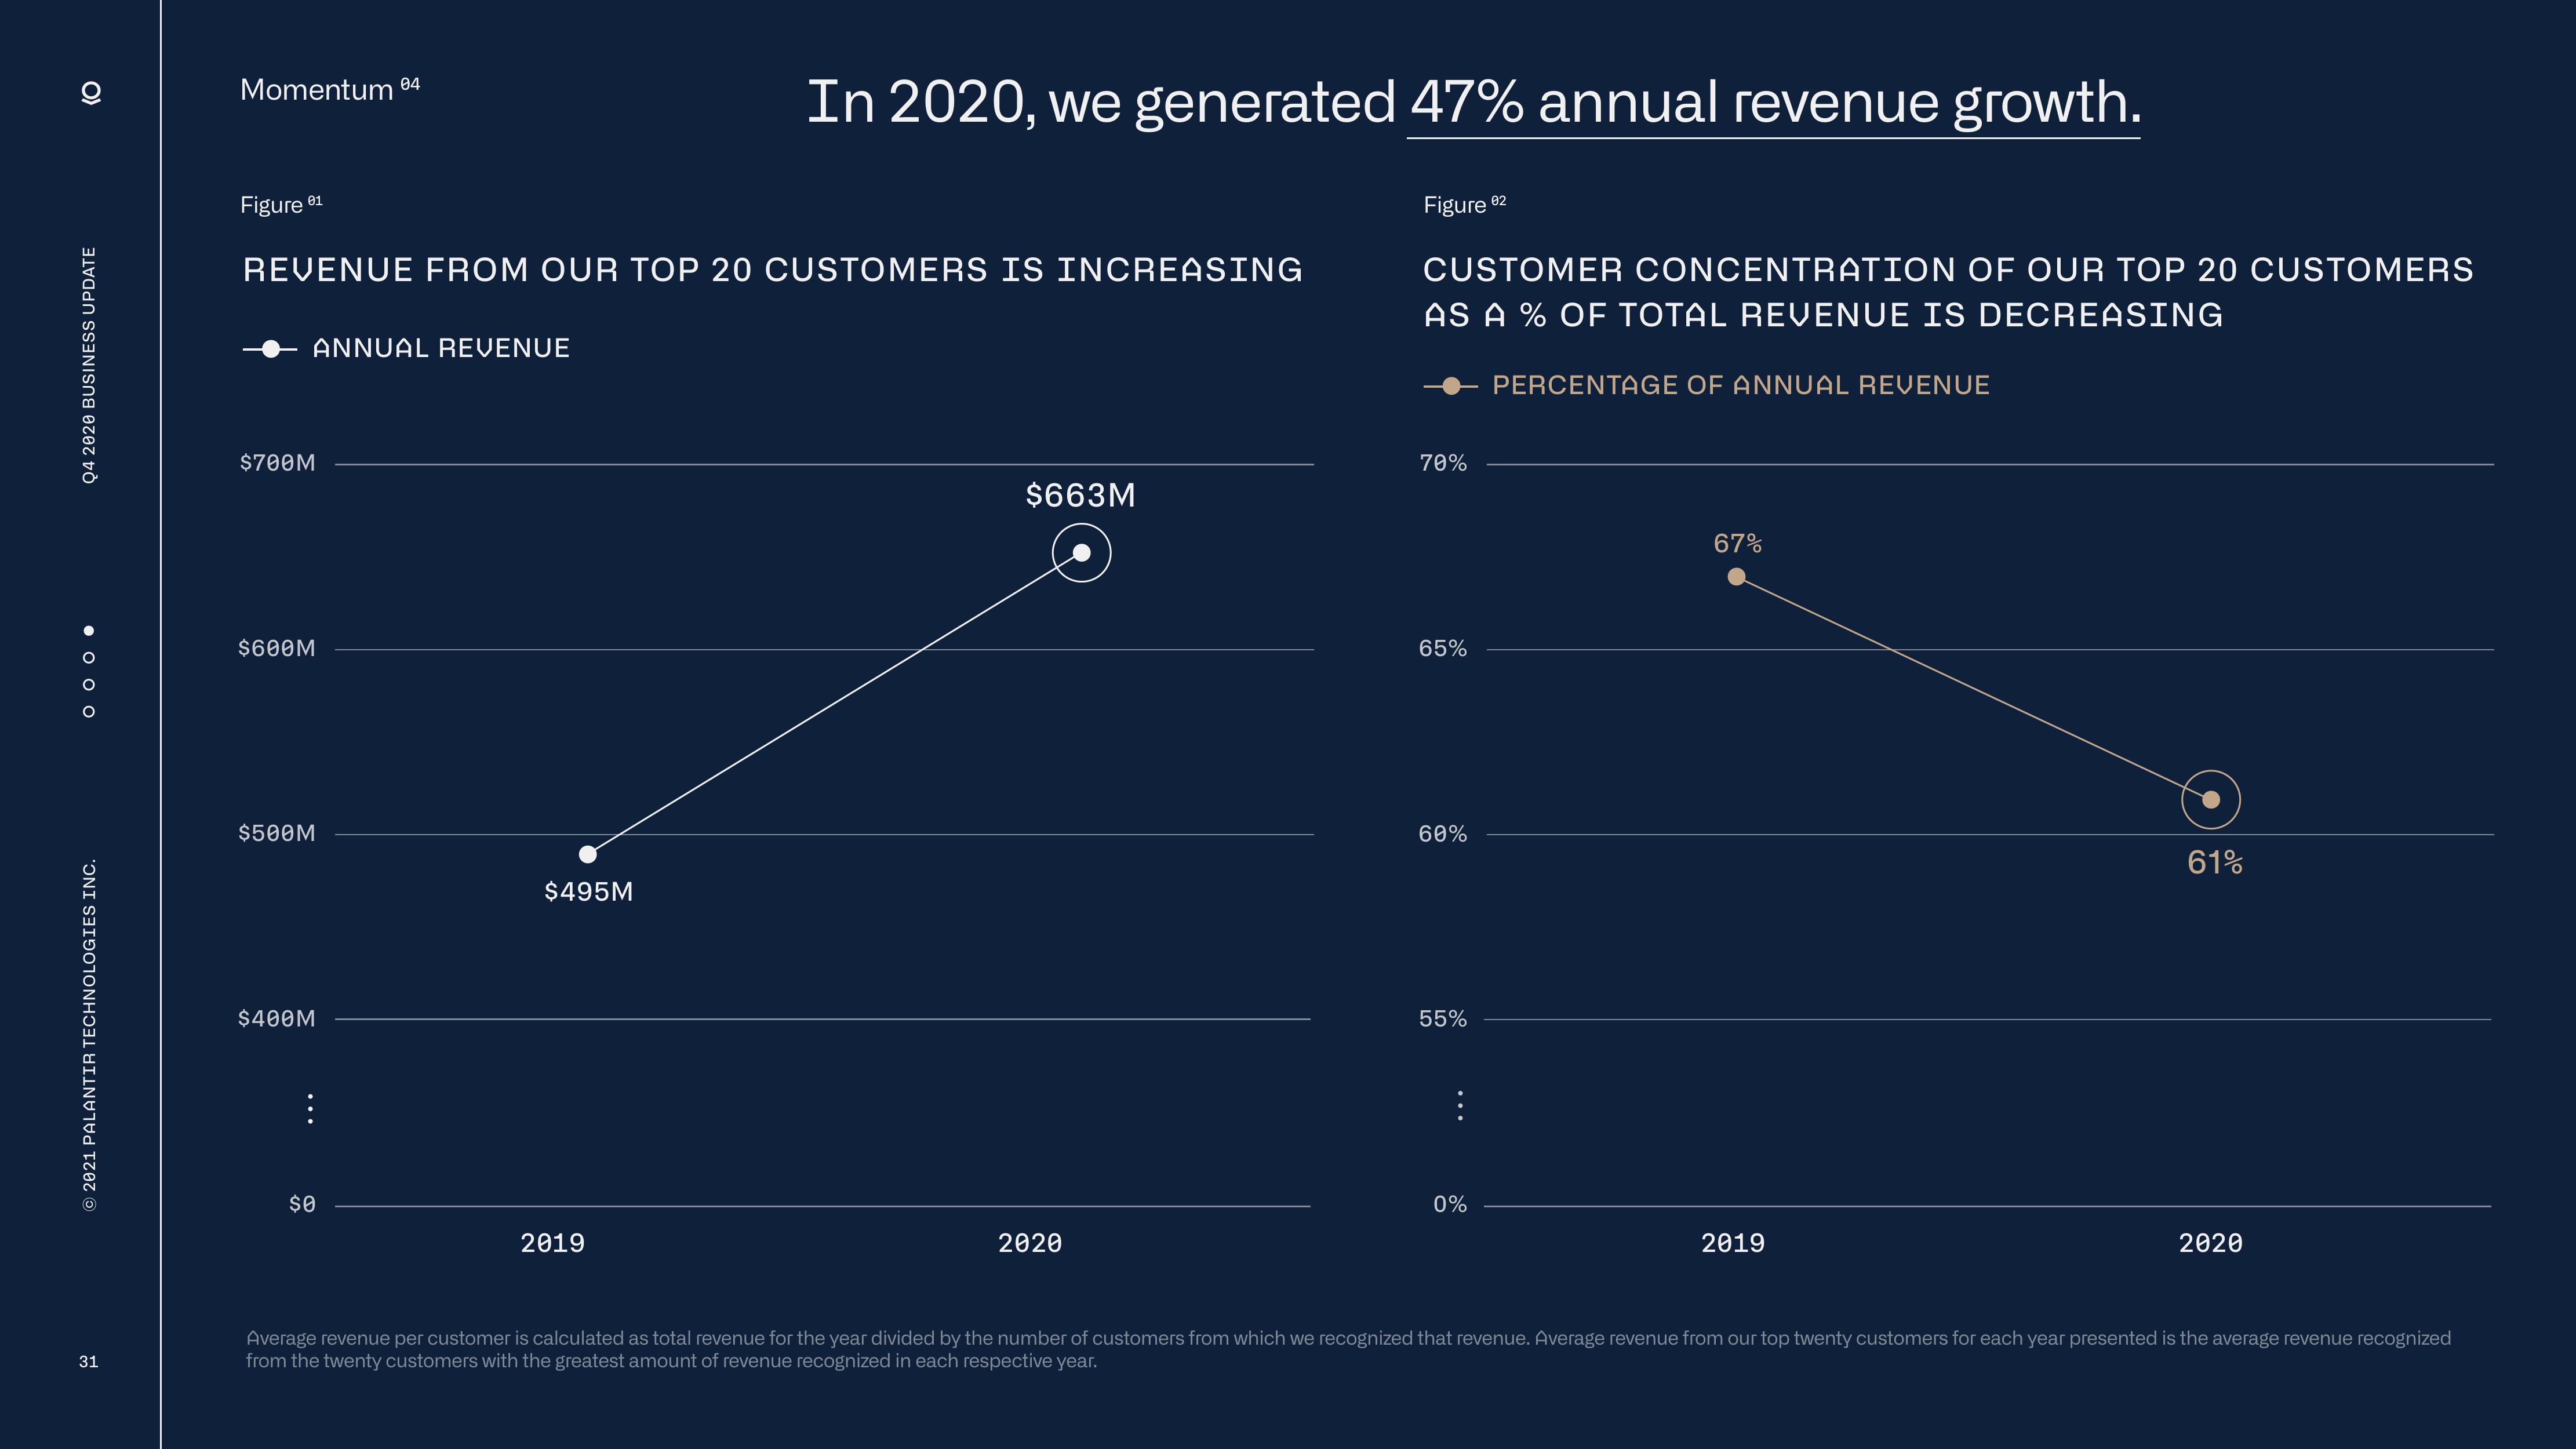
REVENUE FROM OUR TOP 20 CUSTOMERS IS INCREASING
ANNUAL REVENUE
$700M
$600M
$500M
$400M
$0
$495M
In 2020, we generated 47% annual revenue growth.
2019
$663M
2020
Figure 02
CUSTOMER CONCENTRATION OF OUR TOP 20 CUSTOMERS
AS A % OF TOTAL REVENUE IS DECREASING
70%
65%
60%
55%
0%
PERCENTAGE OF ANNUAL REVENUE
67%
2019
61%
2020
Average revenue per customer is calculated as total revenue for the year divided by the number of customers from which we recognized that revenue. Average revenue from our top twenty customers for each year presented is the average revenue recognized
from the twenty customers with the greatest amount of revenue recognized in each respective year.View entire presentation