Sonder Investor Presentation Deck
Non-GAAP Reconciliations
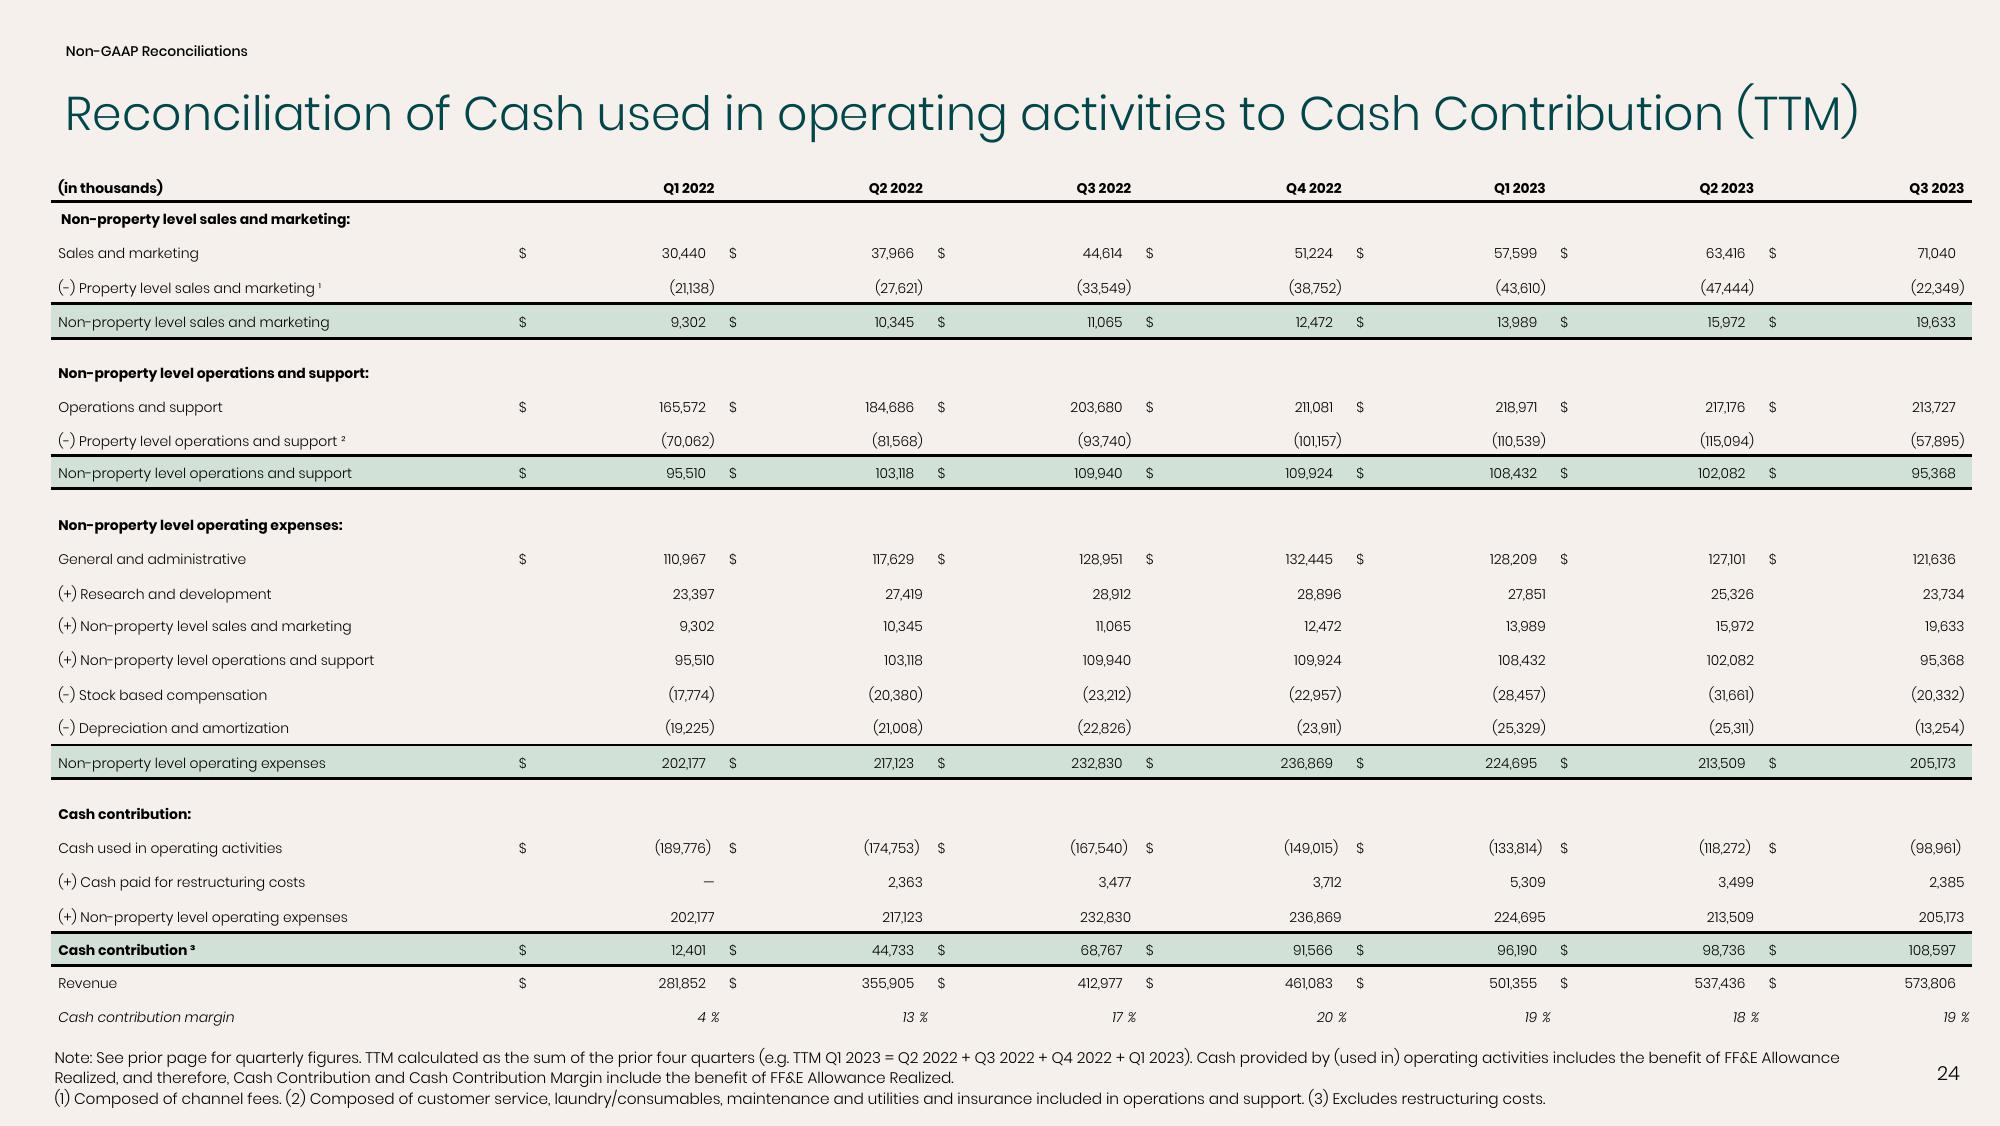
Reconciliation of Cash used in operating activities to Cash Contribution (TTM)
(in thousands)
Non-property level sales and marketing:
Sales and marketing
(-) Property level sales and marketing¹
Non-property level sales and marketing
Non-property level operations and support:
Operations and support
(-) Property level operations and support ²
Non-property level operations and support
Non-property level operating expenses:
General and administrative
(+) Research and development
(+) Non-property level sales and marketing
(+) Non-property level operations and support
(-) Stock based compensation
(-) Depreciation and amortization
Non-property level operating expenses
Cash contribution:
Cash used in operating activities
(+) Cash paid for restructuring costs
(+) Non-property level operating expenses
Cash contribution ³
Revenue
Cash contribution margin
$
$
$
$
$
$
$
$
$
Q1 2022
30,440
(21,138)
9,302
165,572
110,967
23,397
(70,062)
95,510 S
9,302
202,177
S
12,401
S
95,510
(17,774)
(19,225)
202,177 S
281,852
S
(189,776) S
4%
S
S
S
Q2 2022
37,966
(27,621)
10,345
184,686
(81,568)
103,118
117,629
27,419
10,345
103,118
(20,380)
(21,008)
217,123
2,363
217,123
44,733
355.905
$
13 %
$
(174,753) $
$
$
$
$
$
$
Q3 2022
44,614
(33,549)
11,065
109,940
203,680 $
(93,740)
128,951
28,912
11,065
109,940
(23,212)
(22,826)
232,830
3,477
232,830
$
68,767
412,977
$
17%
(167,540) $
$
$
$
$
$
Q4 2022
51,224 $
(38,752)
12,472
211,081
(101,157)
109,924
28,896
12,472
132,445 $
109,924
(22,957)
(23,911)
236,869
3,712
236,869
91,566
$
(149,015) $
461,083
$
20 %
$
$
$
$
Q1 2023
57,599
(43,610)
13,989
218,971
(110,539)
108,432
128,209
27,851
13,989
108,432
(28,457)
(25,329)
224,695
5,309
224,695
96.190
$
$
19 %
$
(133,814) $
$
$
$
$
501,355 $
Q2 2023
63,416
(47,444)
15,972 $
217,176
(115,094)
102,082
127,101
25,326
15,972
3,499
213,509
$
102,082
(31,661)
(25,311)
213,509 $
98,736
(118,272) $
537,436
$
18%
$
$
$
$
Note: See prior page for quarterly figures. TTM calculated as the sum of the prior four quarters (e.g. TTM Q1 2023 = Q2 2022 + Q3 2022 + Q4 2022 + Q1 2023). Cash provided by (used in) operating activities includes the benefit of FF&E Allowance
Realized, and therefore, Cash Contribution and Cash Contribution Margin include the benefit of FF&E Allowance Realized.
(1) Composed of channel fees. (2) Composed of customer service, laundry/consumables, maintenance and utilities and insurance included in operations and support. (3) Excludes restructuring costs.
Q3 2023
71,040
(22,349)
19,633
213,727
(57,895)
95,368
121,636
23,734
19,633
95,368
(20,332)
(13,254)
205,173
(98,961)
2,385
205,173
108,597
573,806
19%
24View entire presentation