Evercore Investment Banking Pitch Book
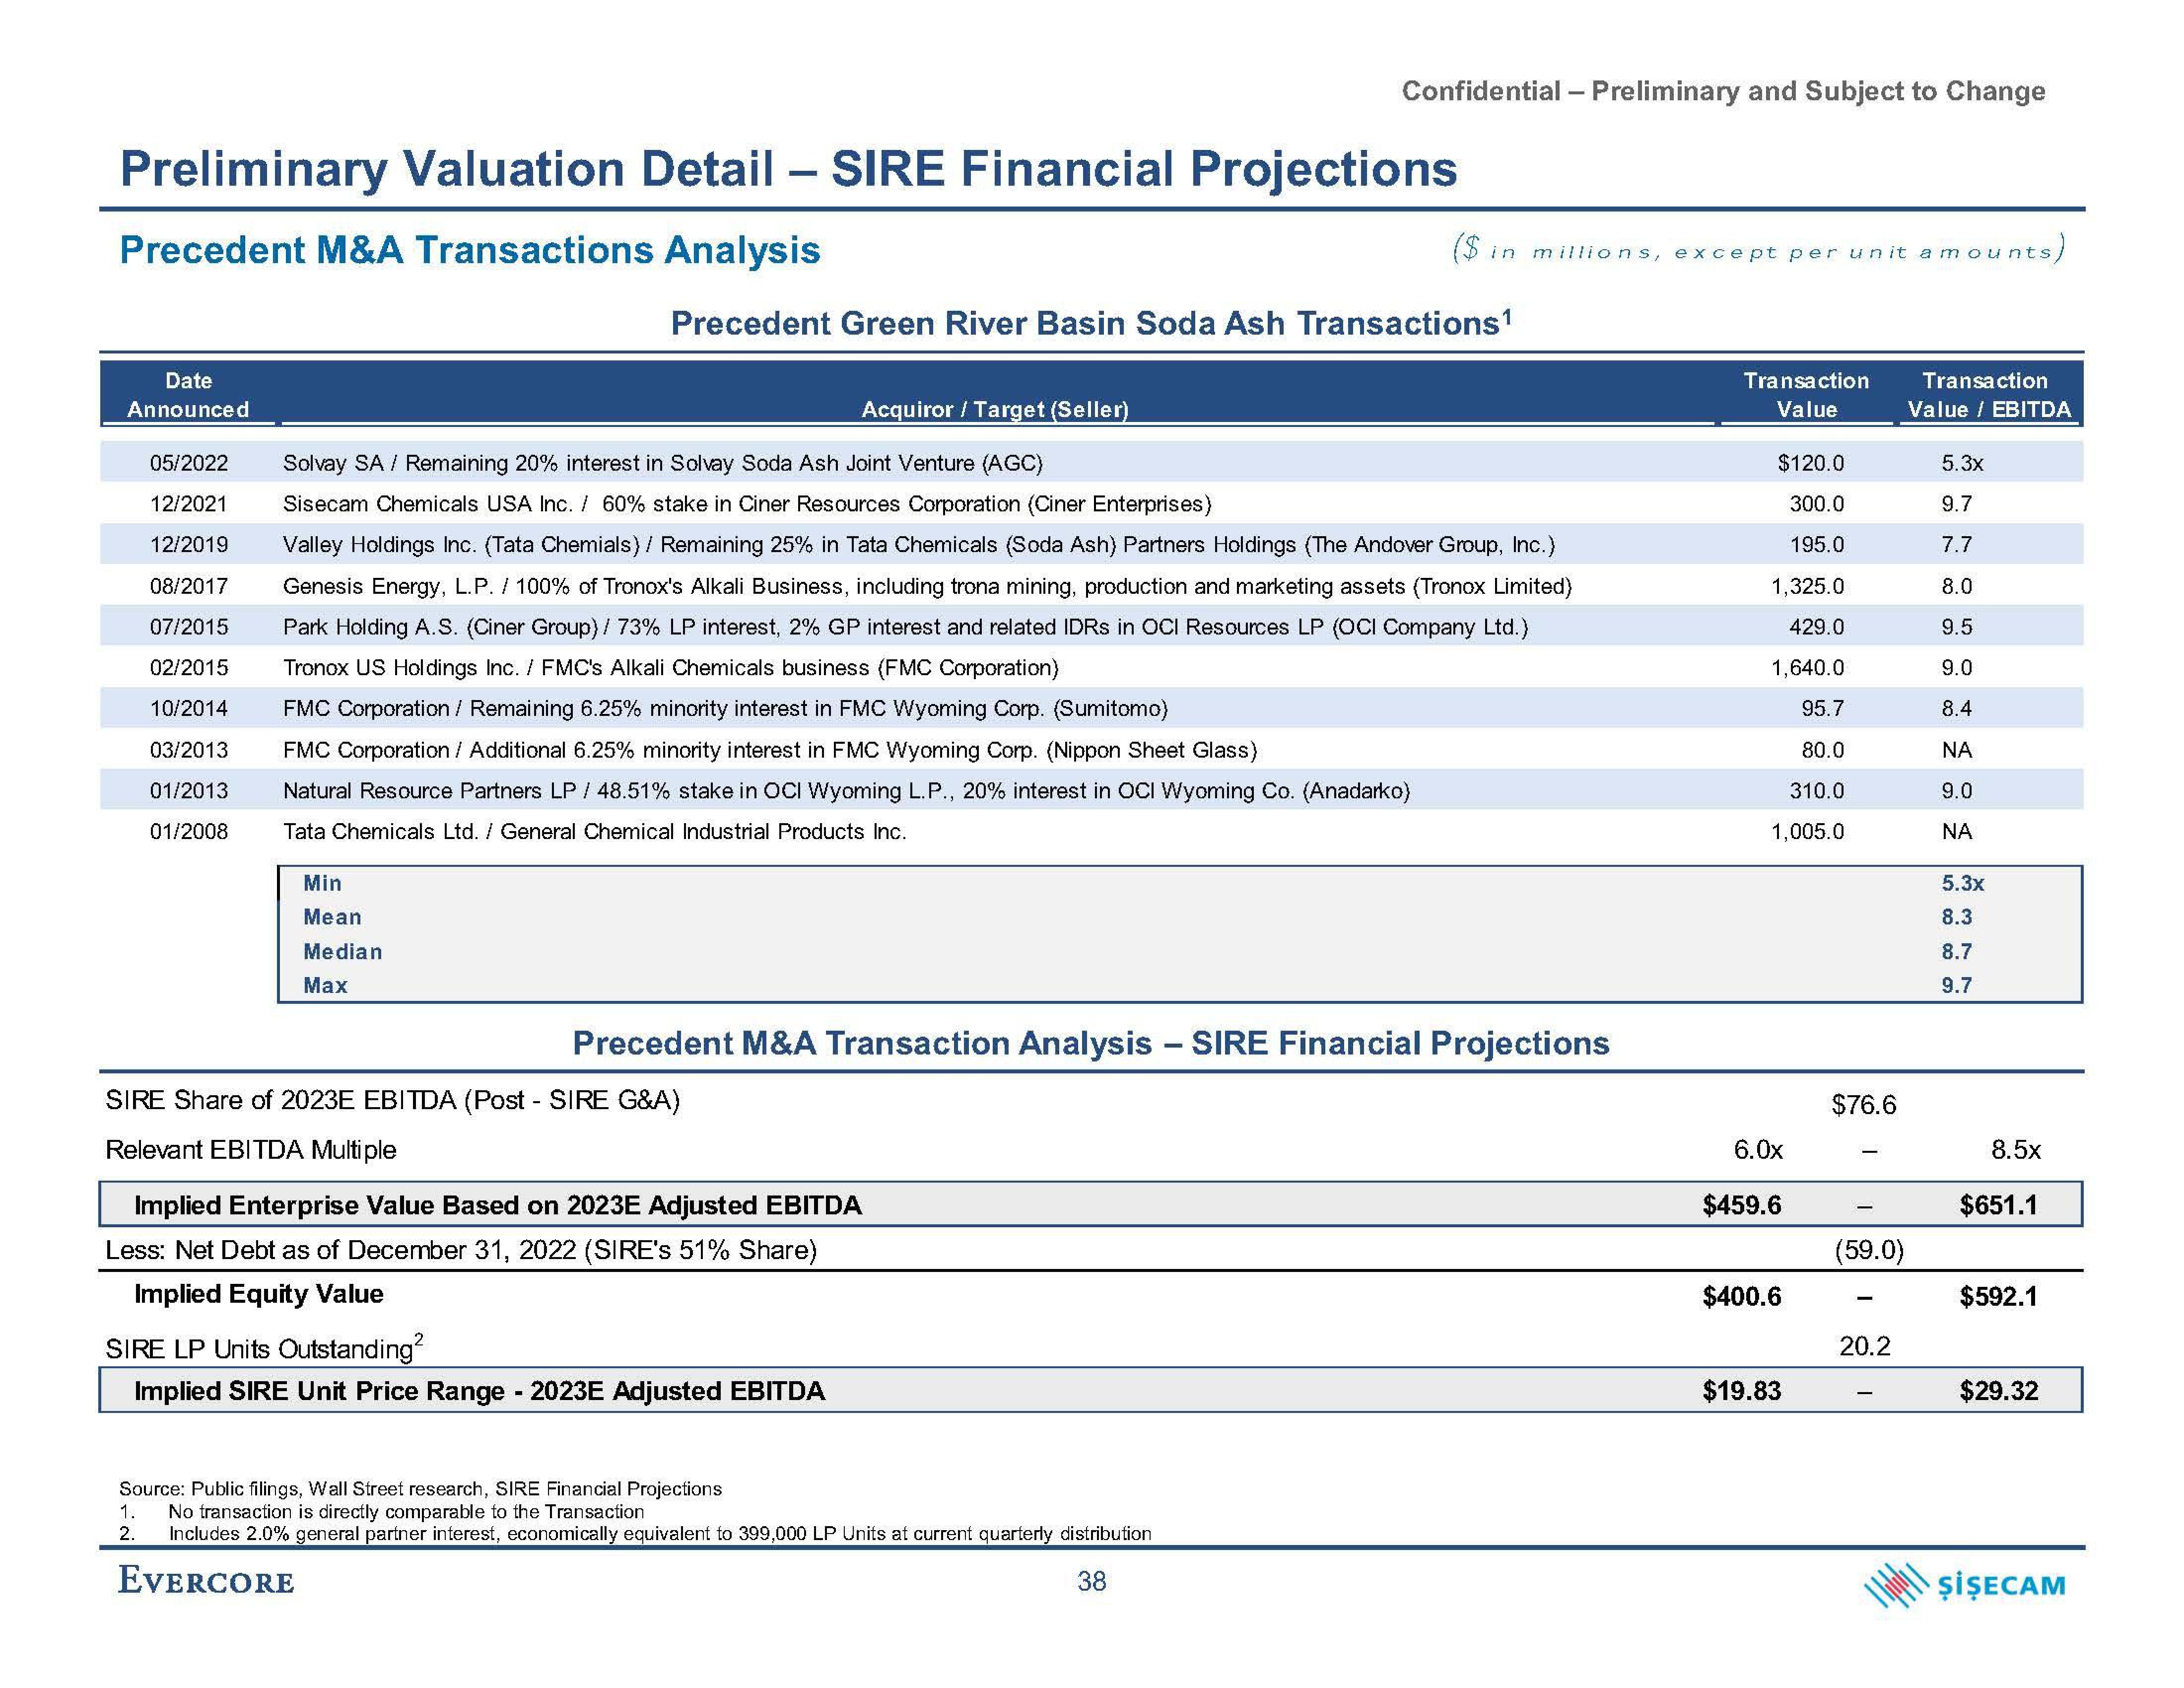
Preliminary Valuation Detail - SIRE Financial Projections
Precedent M&A Transactions Analysis
Date
Announced
Min
Mean
Median
Max
Precedent Green River Basin Soda Ash Transactions¹
Acquiror / Target (Seller)
ises)
05/2022 Solvay SA / Remaining 20% interest in Solvay Soda Ash Joint Venture (AGC)
12/2021 Sisecam Chemicals USA Inc. / 60% stake in Ciner Resources orporation (Ciner
12/2019 Valley Holdings Inc. (Tata Chemials) / Remaining 25% in Tata Chemicals (Soda Ash) Partners Holdings (The Andover Group, Inc.)
08/2017 Genesis Energy, L.P. / 100% of Tronox's Alkali Business, including trona mining, production and marketing assets (Tronox Limited)
07/2015 Park Holding A.S. (Ciner Group) / 73% LP interest, 2% GP interest and related IDRs in OCI Resources LP (OCI Company Ltd.)
Tronox US Holdings Inc. / FMC's Alkali Chemicals business (FMC Corporation)
02/2015
10/2014
FMC Corporation / Remaining 6.25% minority interest in FMC Wyoming Corp. (Sumitomo)
03/2013
FMC Corporation / Additional 6.25% minority interest in FMC Wyoming Corp. (Nippon Sheet Glass)
01/2013
Natural Resource Partners LP / 48.51% stake in OCI Wyoming L.P., 20% interest in OCI Wyoming Co. (Anadarko)
Tata Chemicals Ltd. / General Chemical Industrial Products Inc.
01/2008
Confidential - Preliminary and Subject to Change
SIRE Share of 2023E EBITDA (Post - SIRE G&A)
Relevant EBITDA Multiple
Precedent M&A Transaction Analysis - SIRE Financial Projections
Implied Enterprise Value Based on 2023E Adjusted EBITDA
Less: Net Debt as of December 31, 2022 (SIRE's 51% Share)
Implied Equity Value
($ in millions, except per unit amounts,
SIRE LP Units Outstanding²
Implied SIRE Unit Price Range - 2023E Adjusted EBITDA
Source: Public filings, Wall Street research, SIRE Financial Projections
1. No transaction is directly comparable to the Transaction
2.
Includes 2.0% general partner interest, economically equivalent to 399,000 LP Units at current quarterly distribution
EVERCORE
38
Transaction
Value
$120.0
300.0
195.0
1,325.0
429.0
1,640.0
95.7
80.0
310.0
1,005.0
6.0x
$459.6
$400.6
$19.83
$76.6
(59.0)
20.2
Transaction
Value / EBITDA
5.3x
9.7
7.7
8.0
9.5
9.0
8.4
ΝΑ
9.0
ΝΑ
5.3x
8.3
8.7
9.7
8.5x
$651.1
$592.1
$29.32
ŞİŞECAMView entire presentation