AMD Results Presentation Deck
26
APPENDICES
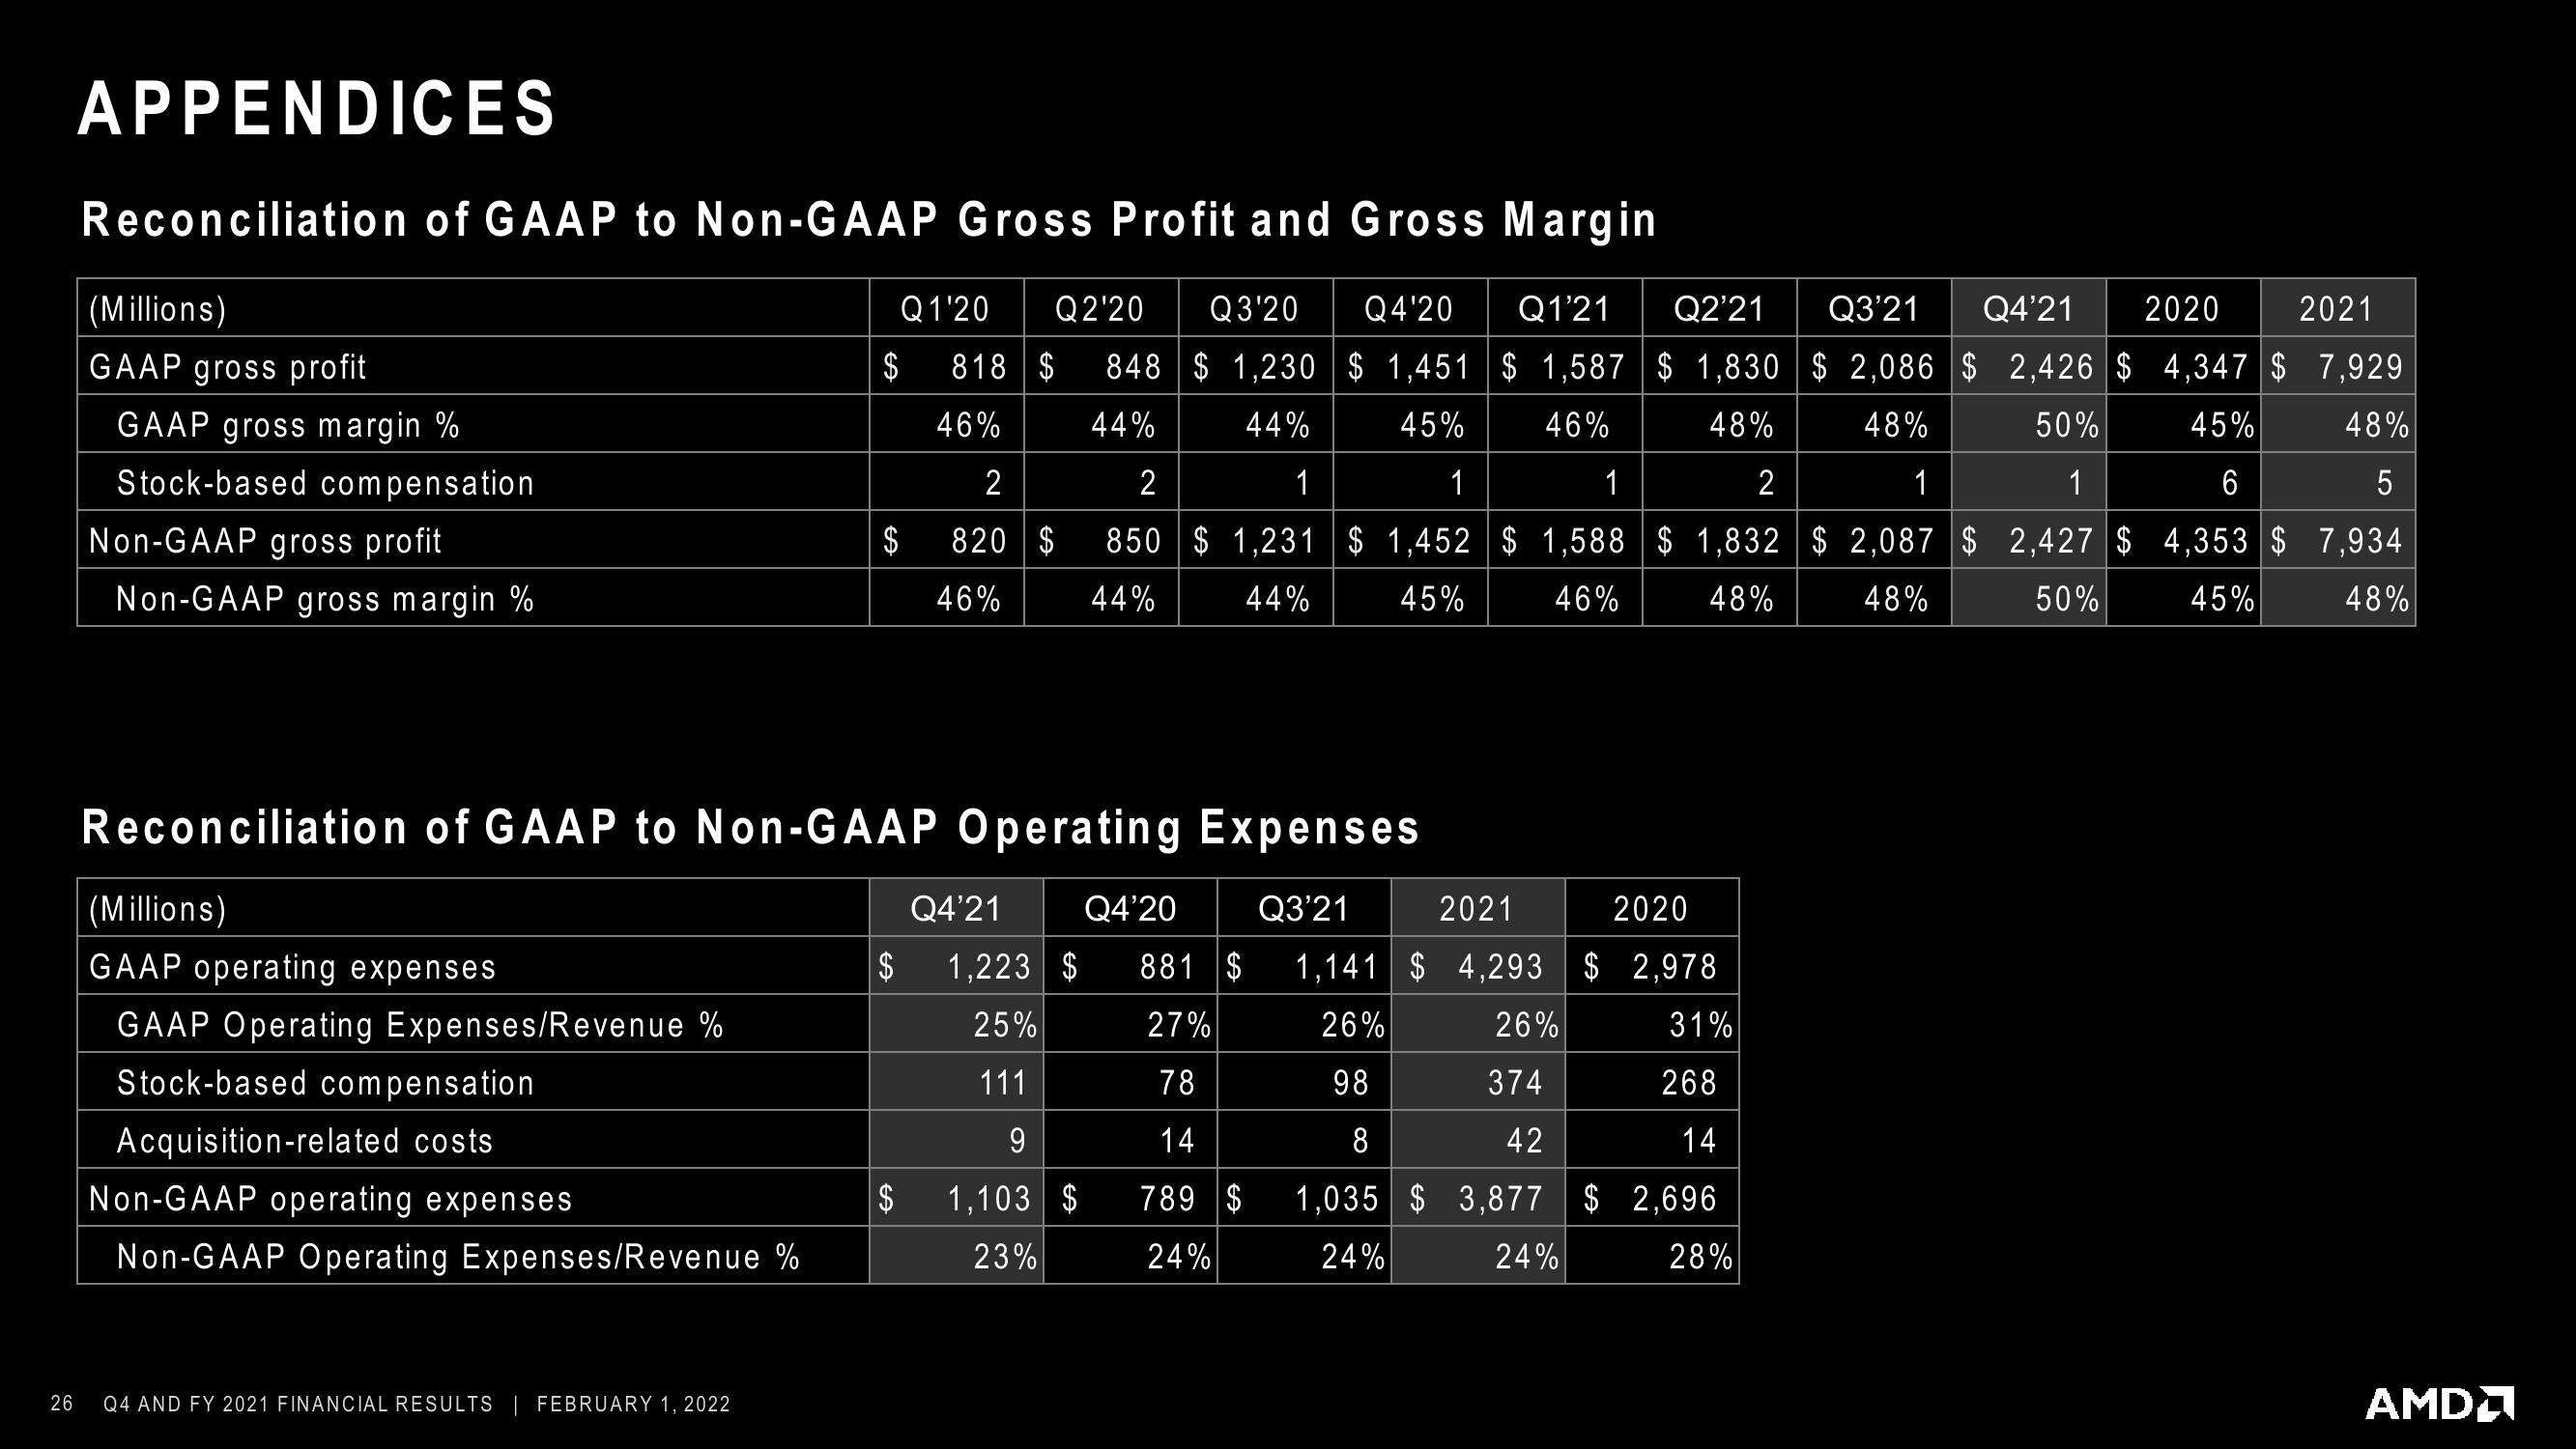
Reconciliation of GAAP to Non-GAAP Gross Profit and Gross Margin
(Millions)
GAAP gross profit
GAAP gross margin %
Stock-based compensation
Non-GAAP gross profit
Non-GAAP gross margin %
(Millions)
GAAP operating expenses
GAAP Operating Expenses/Revenue %
Stock-based compensation
Acquisition-related costs.
Non-GAAP operating expenses
Non-GAAP Operating Expenses/Revenue %
SA
Q4 AND FY 2021 FINANCIAL RESULTS FEBRUARY 1, 2022
Reconciliation of GAAP to Non-GAAP Operating Expenses
$
$
EA
2021
Q1'20 Q2'20 Q3'20 Q4'20 Q1'21 Q2'21 Q3'21 Q4'21 2020
818 $ 848 $ 1,230 $ 1,451 $ 1,587 $ 1,830 $2,086 $ 2,426 $ 4,347 $ 7,929
50%
45% 48%
46%
44%
45%
46%
48%
48%
44%
2
1
2
1
2
1
1
5
1
$1,231 $ 1,452 $ 1,588 $ 1,832
45%
6
$2,087 $ 2,427 $ 4,353 $ 7,934
820 $ 850
46%
44%
44%
46%
48%
48%
45%
50%
48%
$
$
SA
Q4'21
2021
2020
Q4'20 Q3'21
1,223 $ 881 $ 1,141 $ 4,293 $ 2,978
25%
27%
26%
26%
31%
111
78
98
374
268
9
14
8
42
14
789
1,035 $ 3,877 $ 2,696
24%
24%
24%
28%
1,103 $
23%
$
AMDView entire presentation