Sezzle Results Presentation Deck
TOTAL INCOME LESS TRANSACTION RELATED COSTS¹
Total Income Less Transaction Related Costs
as a percent of UMS
$3.8
0.8%
1Q22
$3.8
13.6%
$9.6
2.3%
1Q22
$13.5
3.2%
3Q22
$9.6
32.7%
2Q22
4Q22
Total Income ex. Transaction Related Costs ($US in millions)
Total Income ex. Transaction Related Costs-to-UMS
$20.2
Total Income Less Transaction Related Costs
as a percent of Total Income
$20.2
$13.5
44.5%
4.5%
3Q22
52.8%
2Q22
4Q22
Total Income ex. Transaction Related Costs ($US in millions)
Total Income ex. Transaction Related Costs-to-Total Income
$21.4
5.8%
1Q23
$21.4
61.6%
1Q23
COMMENTARY
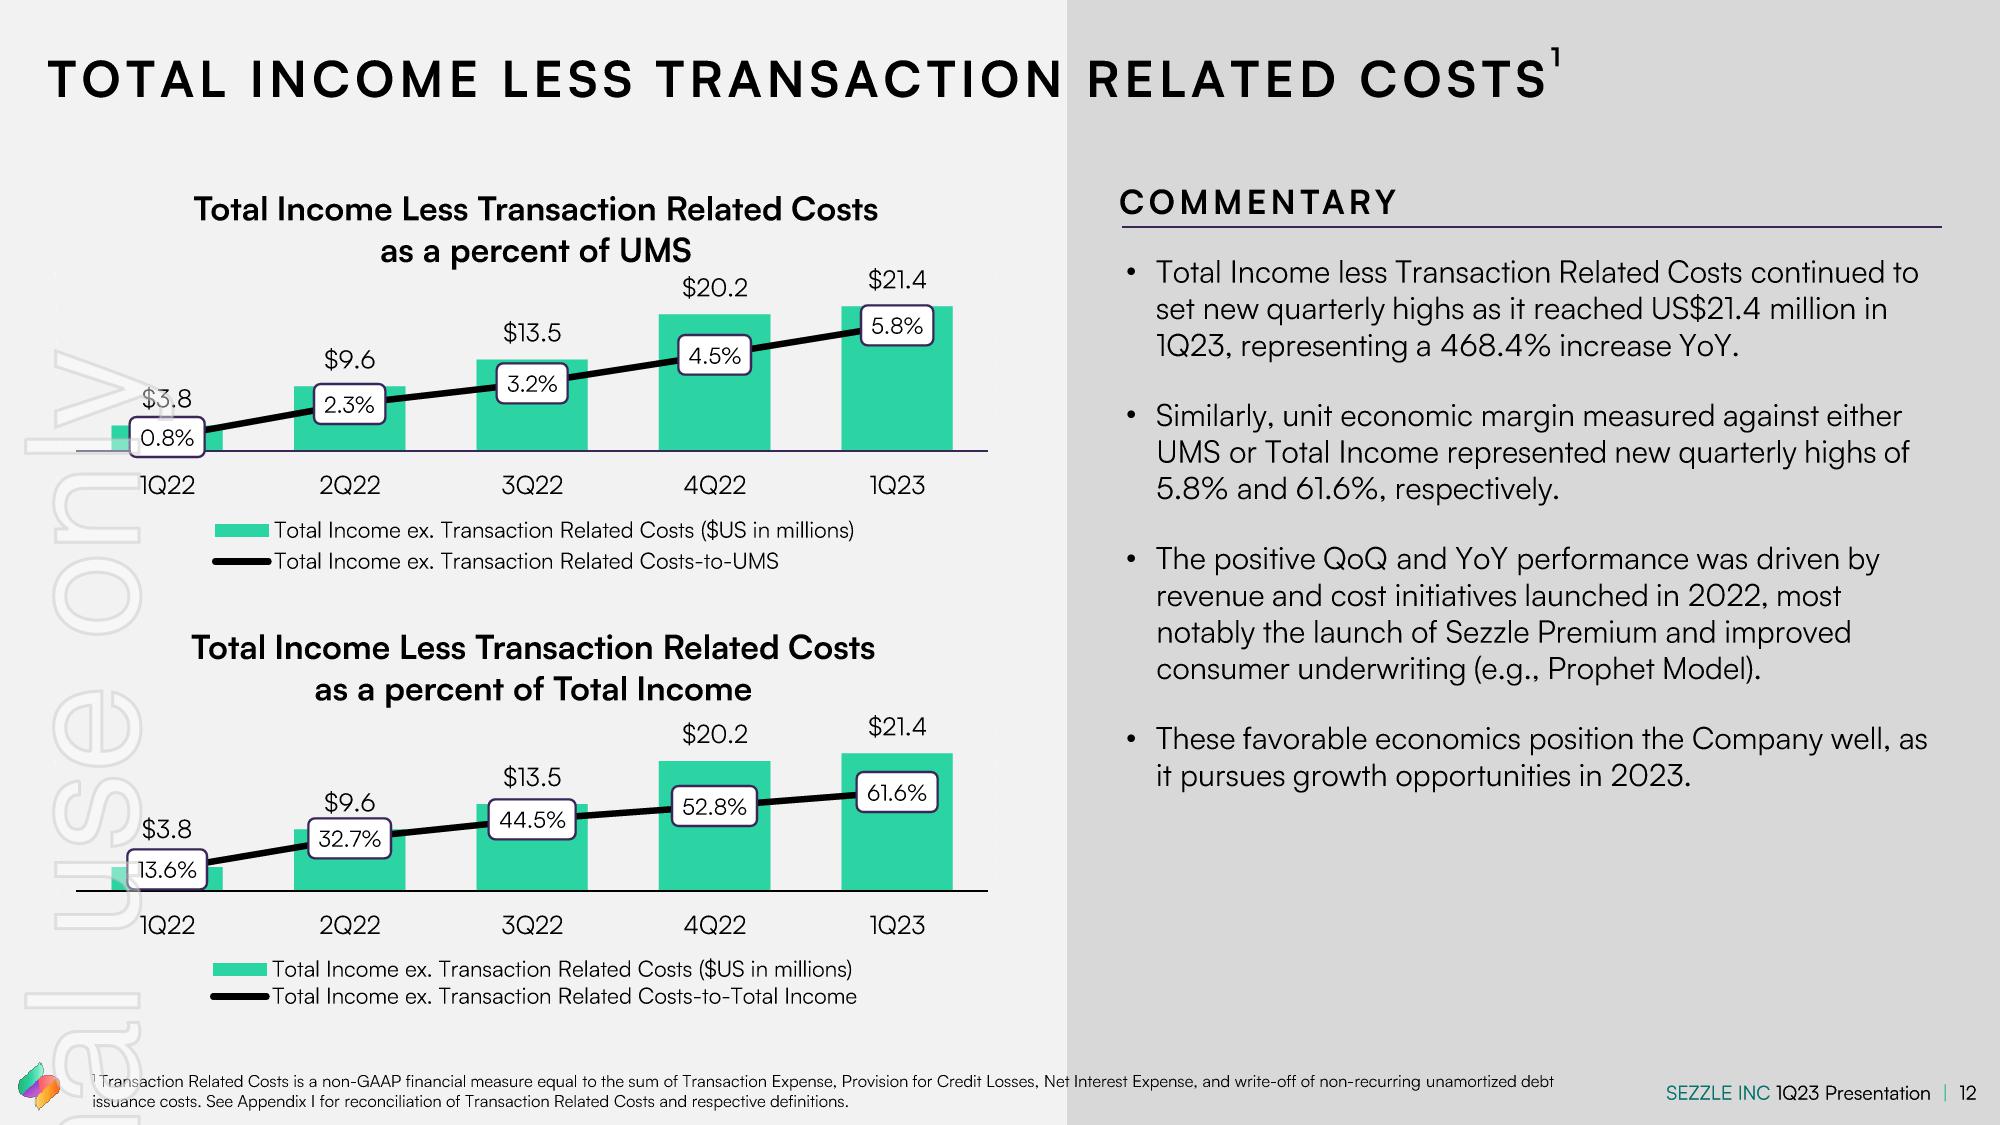
Total Income less Transaction Related Costs continued to
set new quarterly highs as it reached US$21.4 million in
1Q23, representing a 468.4% increase YoY.
●
●
●
Similarly, unit economic margin measured against either
UMS or Total Income represented new quarterly highs of
5.8% and 61.6%, respectively.
The positive QoQ and YoY performance was driven by
revenue and cost initiatives launched in 2022, most
notably the launch of Sezzle Premium and improved
consumer underwriting (e.g., Prophet Model).
These favorable economics position the Company well, as
it pursues growth opportunities in 2023.
Transaction Related Costs is a non-GAAP financial measure equal to the sum of Transaction Expense, Provision for Credit Losses, Net Interest Expense, and write-off of non-recurring unamortized debt
issuance costs. See Appendix I for reconciliation of Transaction Related Costs and respective definitions.
SEZZLE INC 1Q23 Presentation | 12View entire presentation