Nexters Results Presentation Deck
Key financial highlights (2/2)
$m
Selling and Marketing Expenses
6
64
Q3 2021
219
9M 2021
-68%
-49%
20
Q3 2022
112
9M 2022
Source: Company information (unaudited)
$m
G&A Expenses
5
Q3 2021
10
9M 2021
>100%
>100%
14
Q3 2022
28
9M 2022
$m
Total Costs and Expenses, excl. D&A
226
Q3 2021
445
9M 2021
-66%
-42%
76
Q3 2022
256
9M 2022
nexters
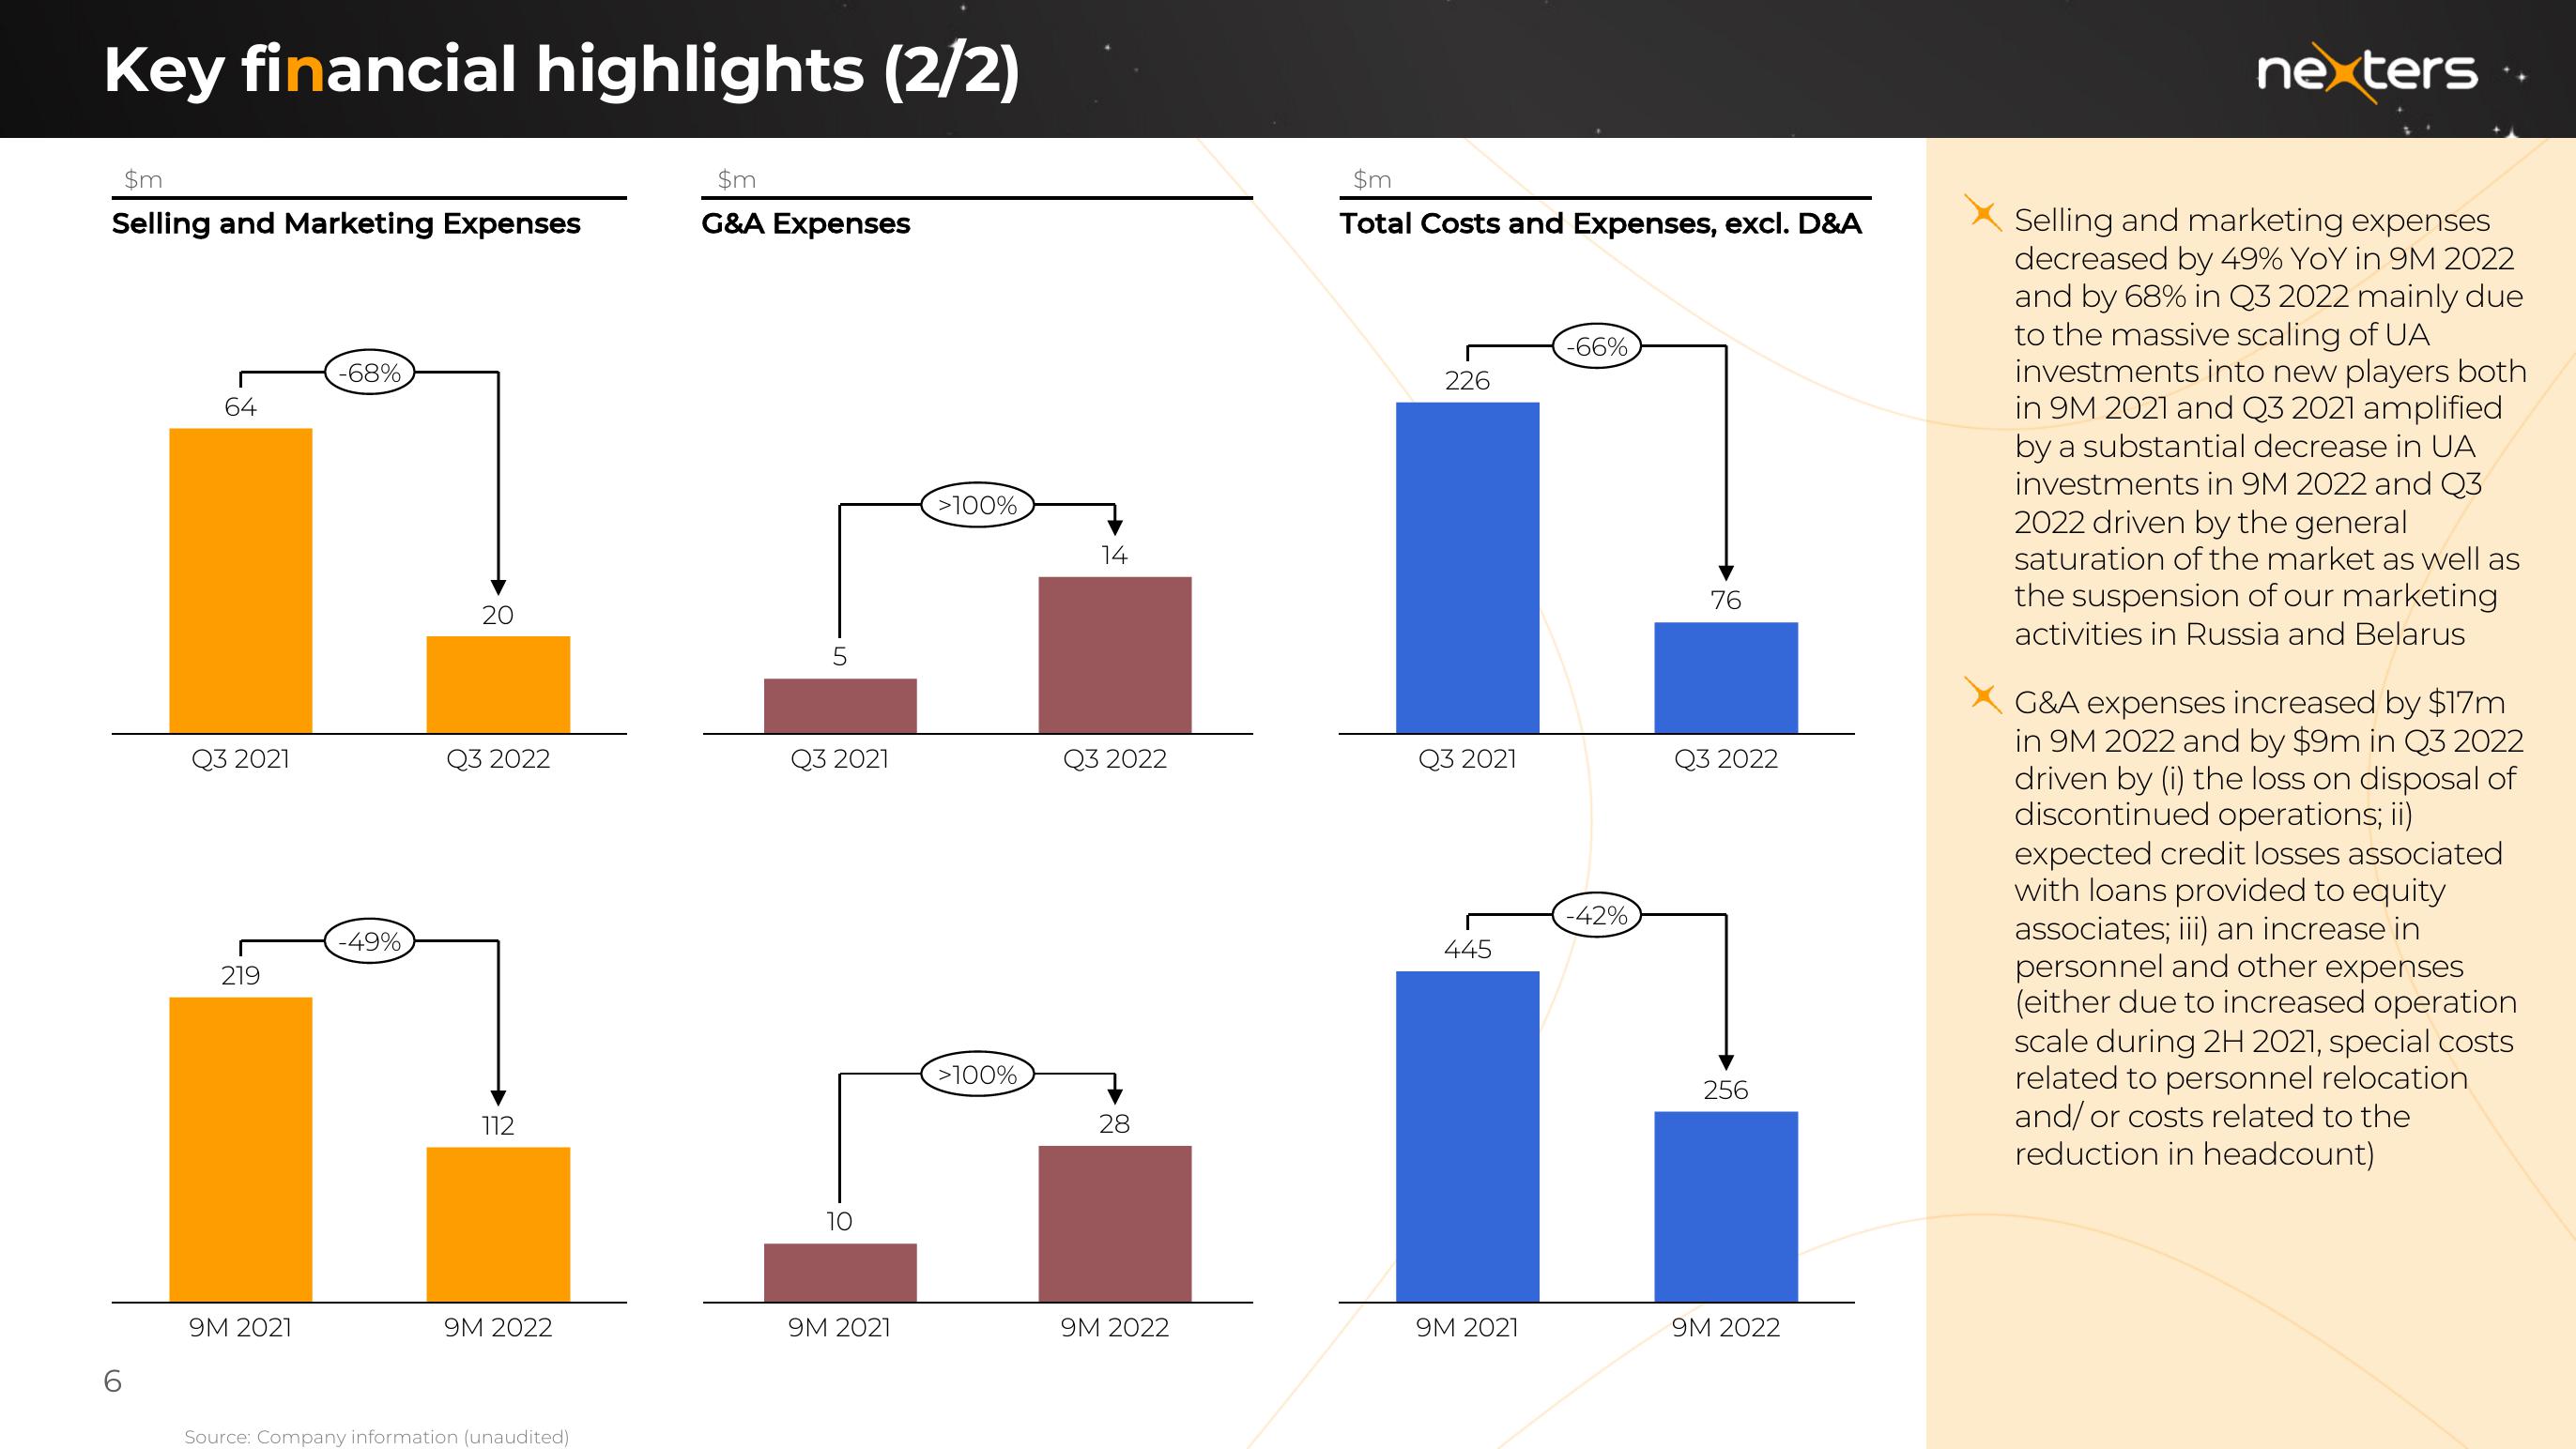
Selling and marketing expenses
decreased by 49% YoY in 9M 2022
and by 68% in Q3 2022 mainly due
to the massive scaling of UA
investments into new players both
in 9M 2021 and Q3 2021 amplified
by a substantial decrease in UA
investments in 9M 2022 and Q3
2022 driven by the general
saturation of the market as well as
the suspension of our marketing
activities in Russia and Belarus
G&A expenses increased by $17m
in 9M 2022 and by $9m in Q3 2022
driven by (i) the loss on disposal of
discontinued operations; ii)
expected credit losses associated
with loans provided to equity
associates; iii) an increase in
personnel and other expenses
(either due to increased operation
scale during 2H 2021, special costs
related to personnel relocation
and/or costs related to the
reduction in headcount)View entire presentation