Prada Results Presentation Deck
●
●
●
€ mln /% change same FX
Asia Pacific
●
Europe
Americas
●
Japan
Middle East
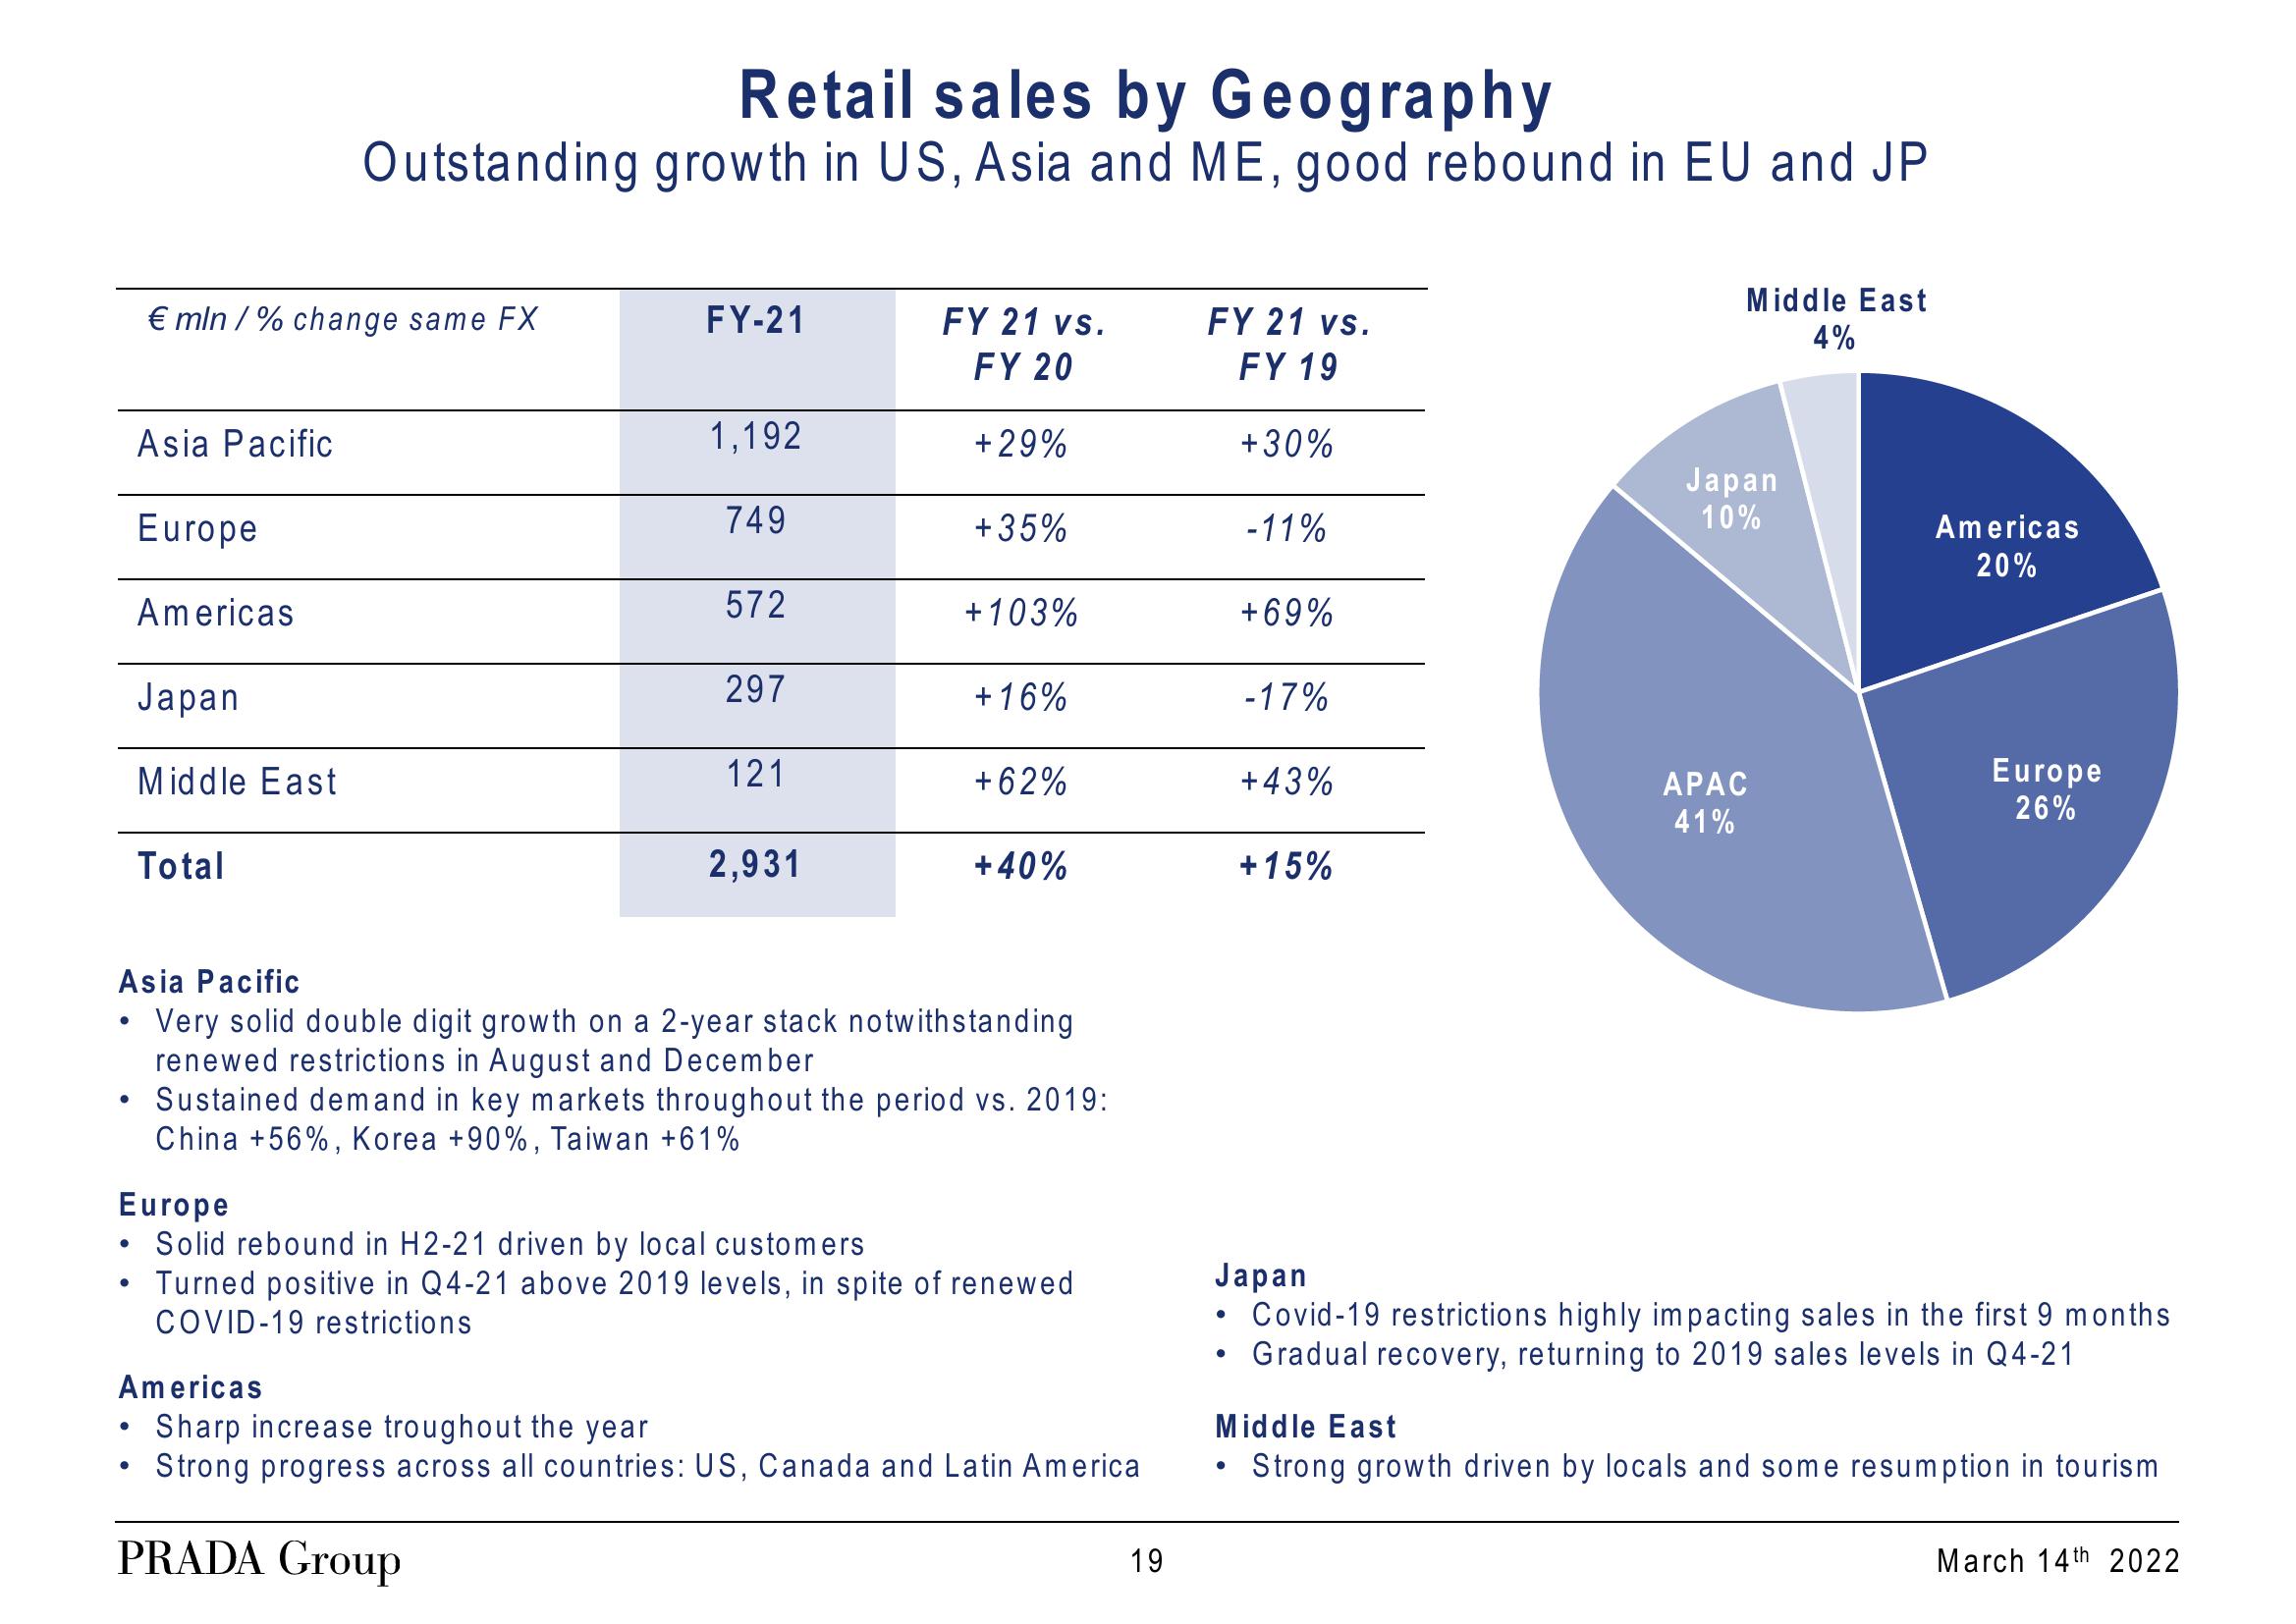
Retail sales by Geography
Outstanding growth in US, Asia and ME, good rebound in EU and JP
Total
FY-21
1,192
749
572
297
121
2,931
FY 21 vs.
FY 20
+29%
+35%
Asia Pacific
Very solid double digit growth on a 2-year stack notwithstanding
renewed restrictions in August and December
• Sustained demand in key markets throughout the period vs. 2019:
China +56%, Korea +90%, Taiwan +61%
+103%
+16%
Europe
Solid rebound in H2-21 driven by local customers
Turned positive in Q4-21 above 2019 levels, in spite of renewed
COVID-19 restrictions
+62%
+40%
Americas
Sharp increase troughout the year
Strong progress across all countries: US, Canada and Latin America
PRADA Group
19
FY 21 vs.
FY 19
+30%
-11%
+69%
●
-17%
+43%
+ 15%
Middle East
4%
Japan
10%
APAC
41%
Americas
20%
Europe
26%
Japan
• Covid-19 restrictions highly impacting sales in the first 9 months
Gradual recovery, returning to 2019 sales levels in Q4-21
Middle East
Strong growth driven by locals and some resumption in tourism
March 14th 2022View entire presentation