Rhode Island State Investment Commission
VALUE CREATION AND IRR MANAGEMENT
On-Ramp / Hold Period
4
4.8
tbd 6.5
Market) VII
ENDEAVOUR
Purchase Multiple
6.0x
VI
Hold Period (years) (³)
6.2x 6.8x 6.9x
V VII VI
Entity Value / EBITDA (¹)
8.5
V
10
9.5x
0.0x
Market
Portfolio Leverage
1.4x
10.0x
V
2.0x 2.7x
Net Debt / EBITDA (¹)
VI
Multiple Expansion at Exit
VII
0.0x
Average Multiple Expansion (2)
4.8x
Market)
5.0x
3.4x 3.5x
VI
V
80%
Invested Capital / Called Capital
% of Capital Invested
5.0x
V
VI VII VIII (Market)
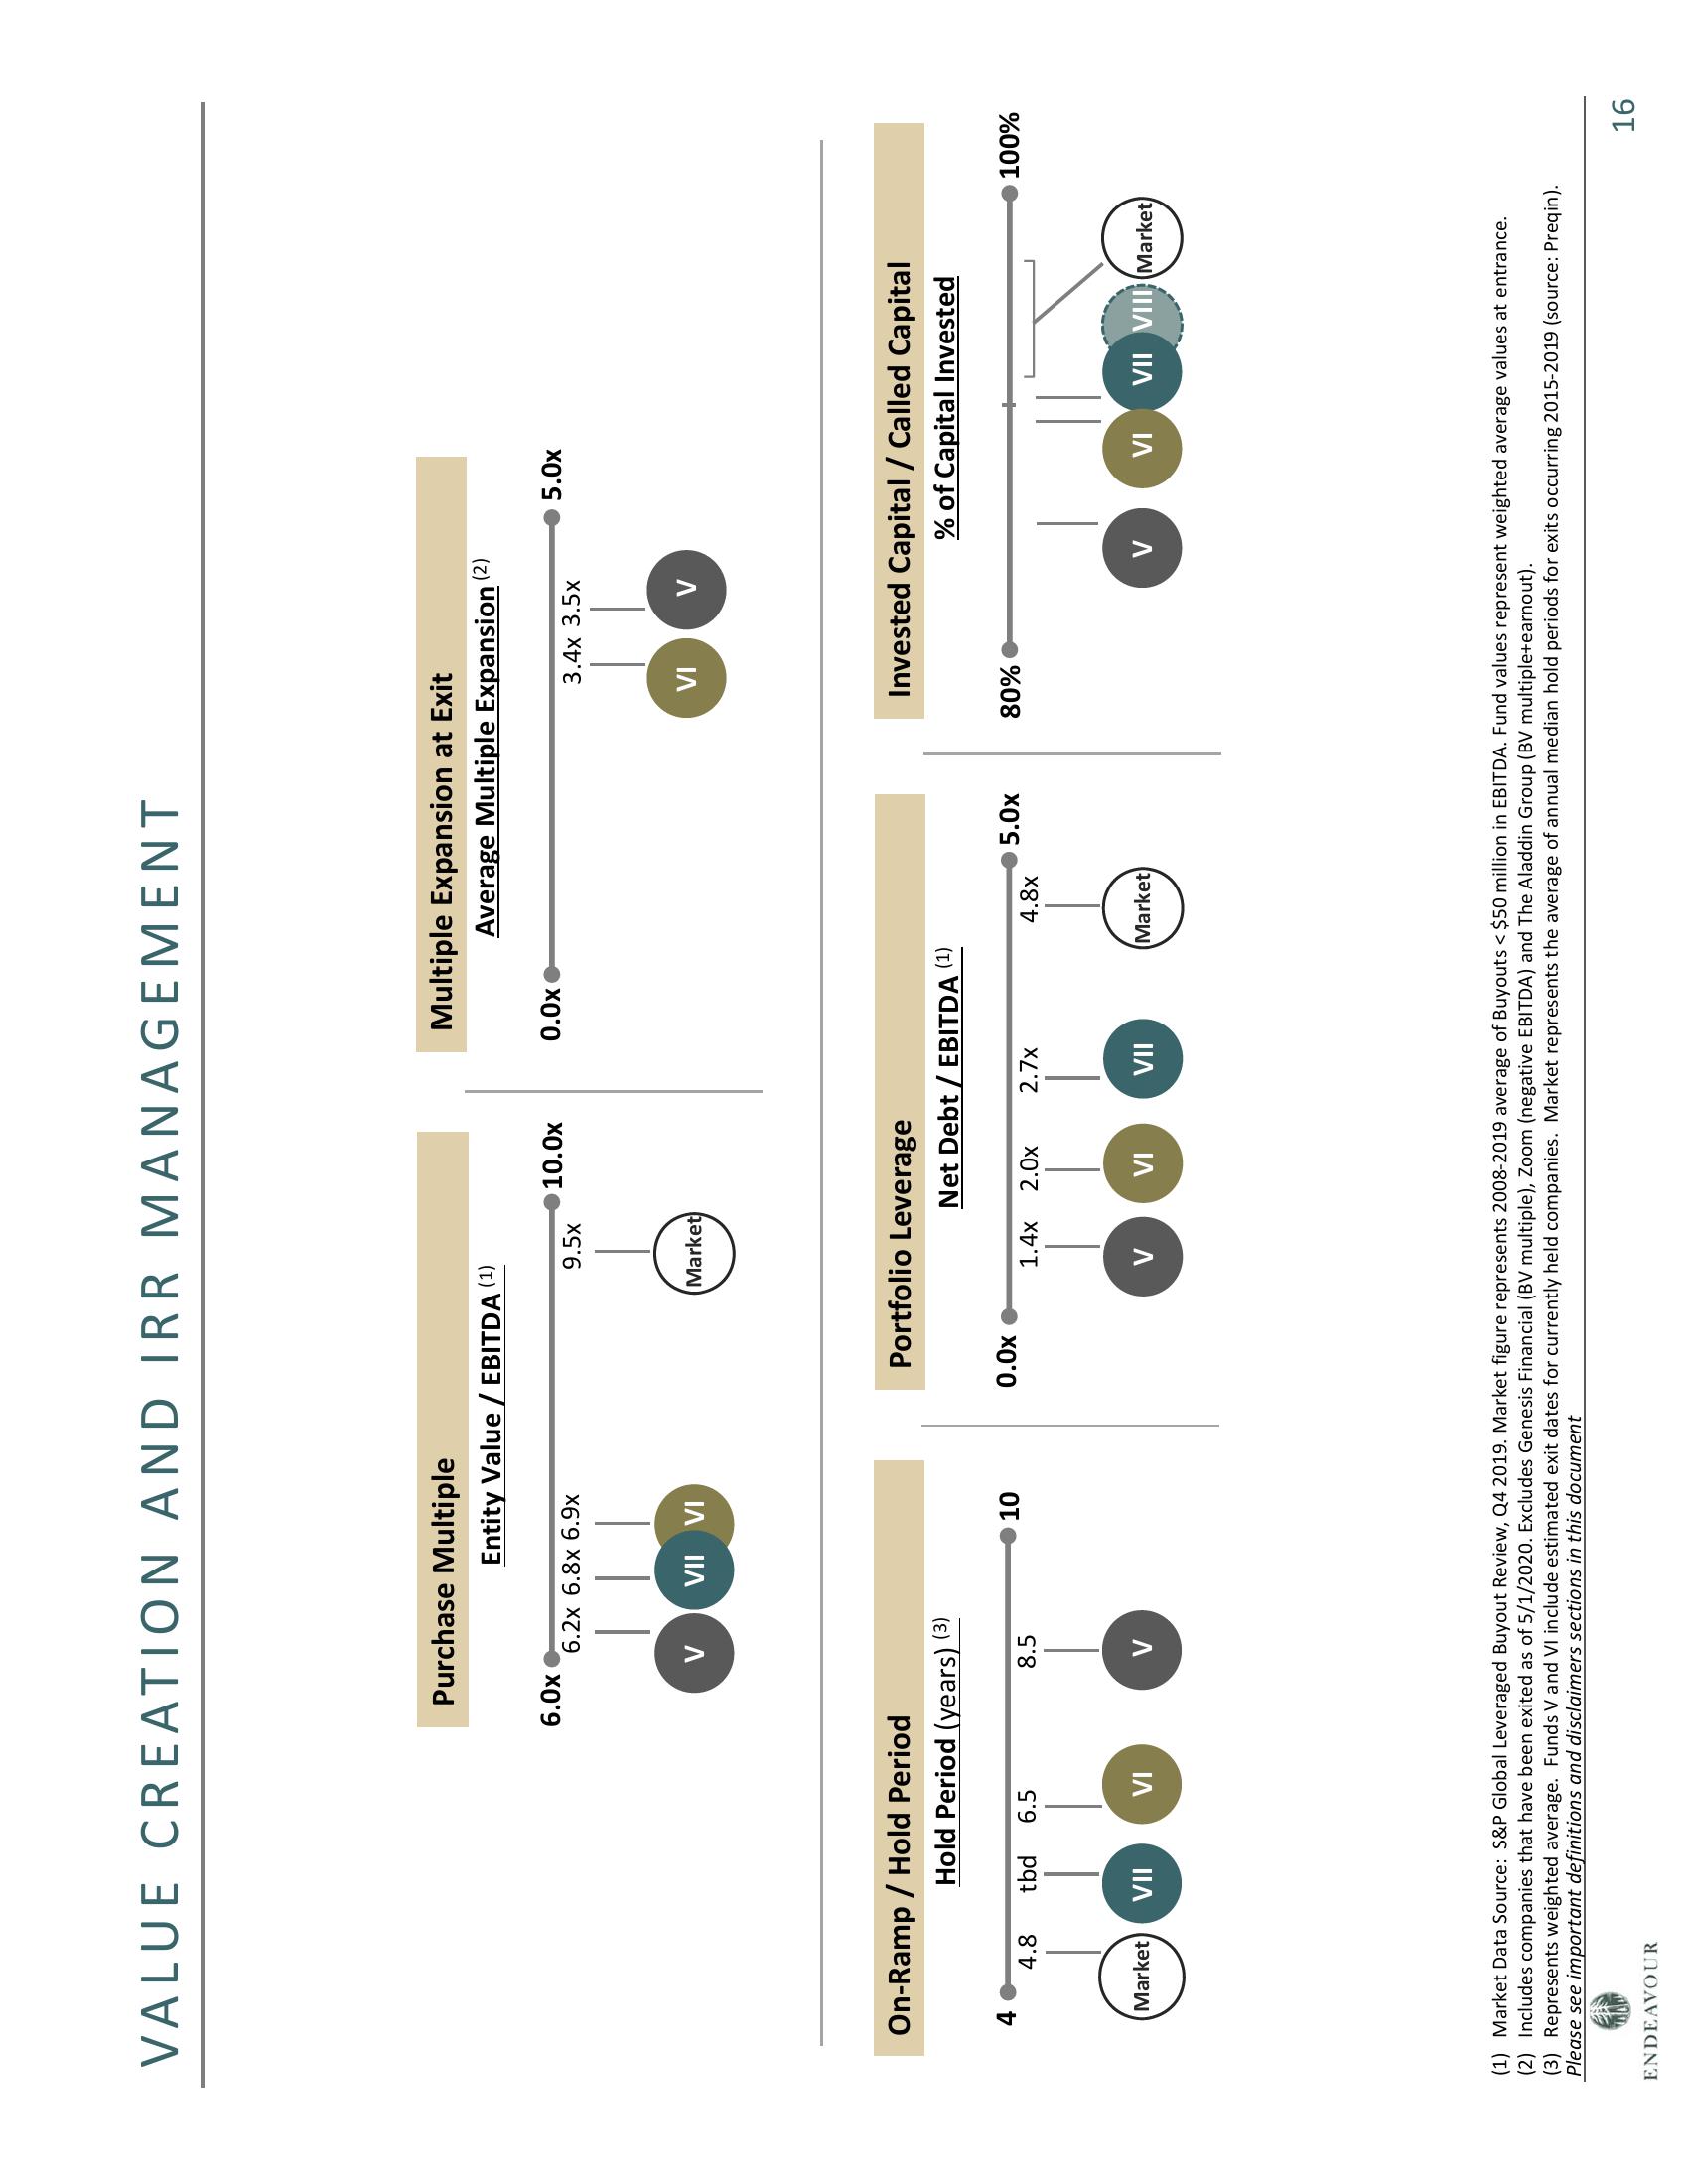
(1) Market Data Source: S&P Global Leveraged Buyout Review, Q4 2019. Market figure represents 2008-2019 average of Buyouts < $50 million in EBITDA. Fund values represent weighted average values at entrance.
(2) Includes companies that have been exited as of 5/1/2020. Excludes Genesis Financial (BV multiple), Zoom (negative EBITDA) and The Aladdin Group (BV multiple+earnout).
(3) Represents weighted average. Funds V and VI include estimated exit dates for currently held companies. Market represents the average of annual median hold periods for exits occurring 2015-2019 (source: Preqin).
Please see important definitions and disclaimers sections in this document
100%
16View entire presentation