WeWork SPAC Presentation Deck
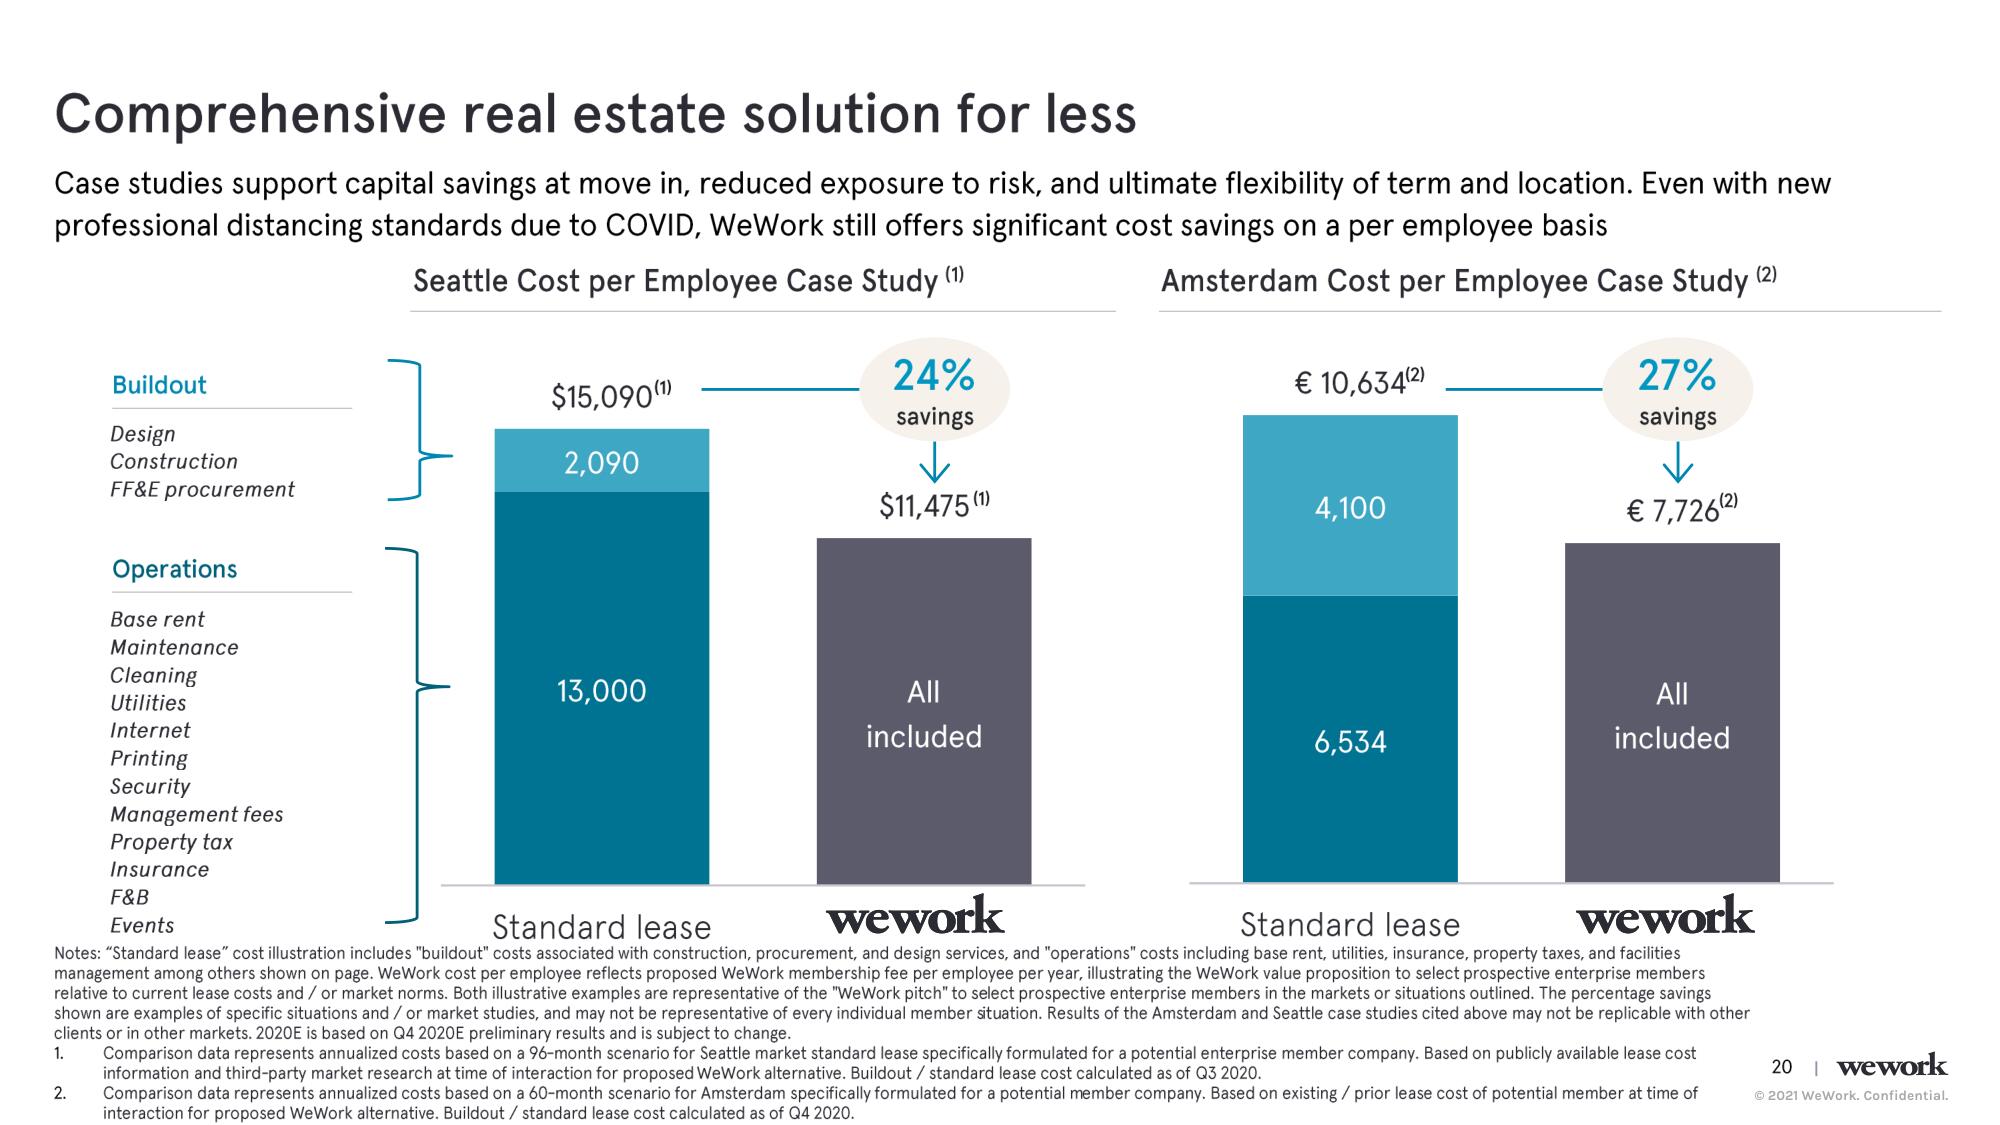
Comprehensive real estate solution for less
Case studies support capital savings at move in, reduced exposure to risk, and ultimate flexibility of term and location. Even with new
professional distancing standards due to COVID, WeWork still offers significant cost savings on a per employee basis
Seattle Cost per Employee Case Study (1)
Amsterdam Cost per Employee Case Study (2)
}
Buildout
2.
Design
Construction
FF&E procurement
Operations
Base rent
Maintenance
Cleaning
Utilities
Internet
Printing
Security
Management fees
Property tax
Insurance
$15,090 (¹)
2,090
13,000
24%
savings
$11,475 (1)
All
included
€ 10,634(2)
4,100
6,534
27%
savings
€7,726(2)
All
included
F&B
Standard lease
wework
Events
Standard lease
wework
Notes: "Standard lease" cost illustration includes "buildout" costs associated with construction, procurement, and design services, and "operations" costs including base rent, utilities, insurance, property taxes, and facilities
management among others shown on page. WeWork cost per employee reflects proposed WeWork membership fee per employee per year, illustrating the WeWork value proposition to select prospective enterprise members
relative to current lease costs and / or market norms. Both illustrative examples are representative of the "WeWork pitch" to select prospective enterprise members in the markets or situations outlined. The percentage savings
shown are examples of specific situations and/or market studies, and may not be representative of every individual member situation. Results of the Amsterdam and Seattle case studies cited above may not be replicable with other
clients or in other markets. 2020E is based on Q4 2020E preliminary results and is subject to change.
1.
Comparison data represents annualized costs based on a 96-month scenario for Seattle market standard lease specifically formulated for a potential enterprise member company. Based on publicly available lease cost
information and third-party market research at time of interaction for proposed WeWork alternative. Buildout / standard lease cost calculated as of Q3 2020.
Comparison data represents annualized costs based on a 60-month scenario for Amsterdam specifically formulated for a potential member company. Based on existing / prior lease cost of potential member at time of
interaction for proposed We Work alternative. Buildout/ standard lease cost calculated as of Q4 2020.
20 wework
Ⓒ2021 WeWork. Confidential.View entire presentation