Maersk Investor Presentation Deck
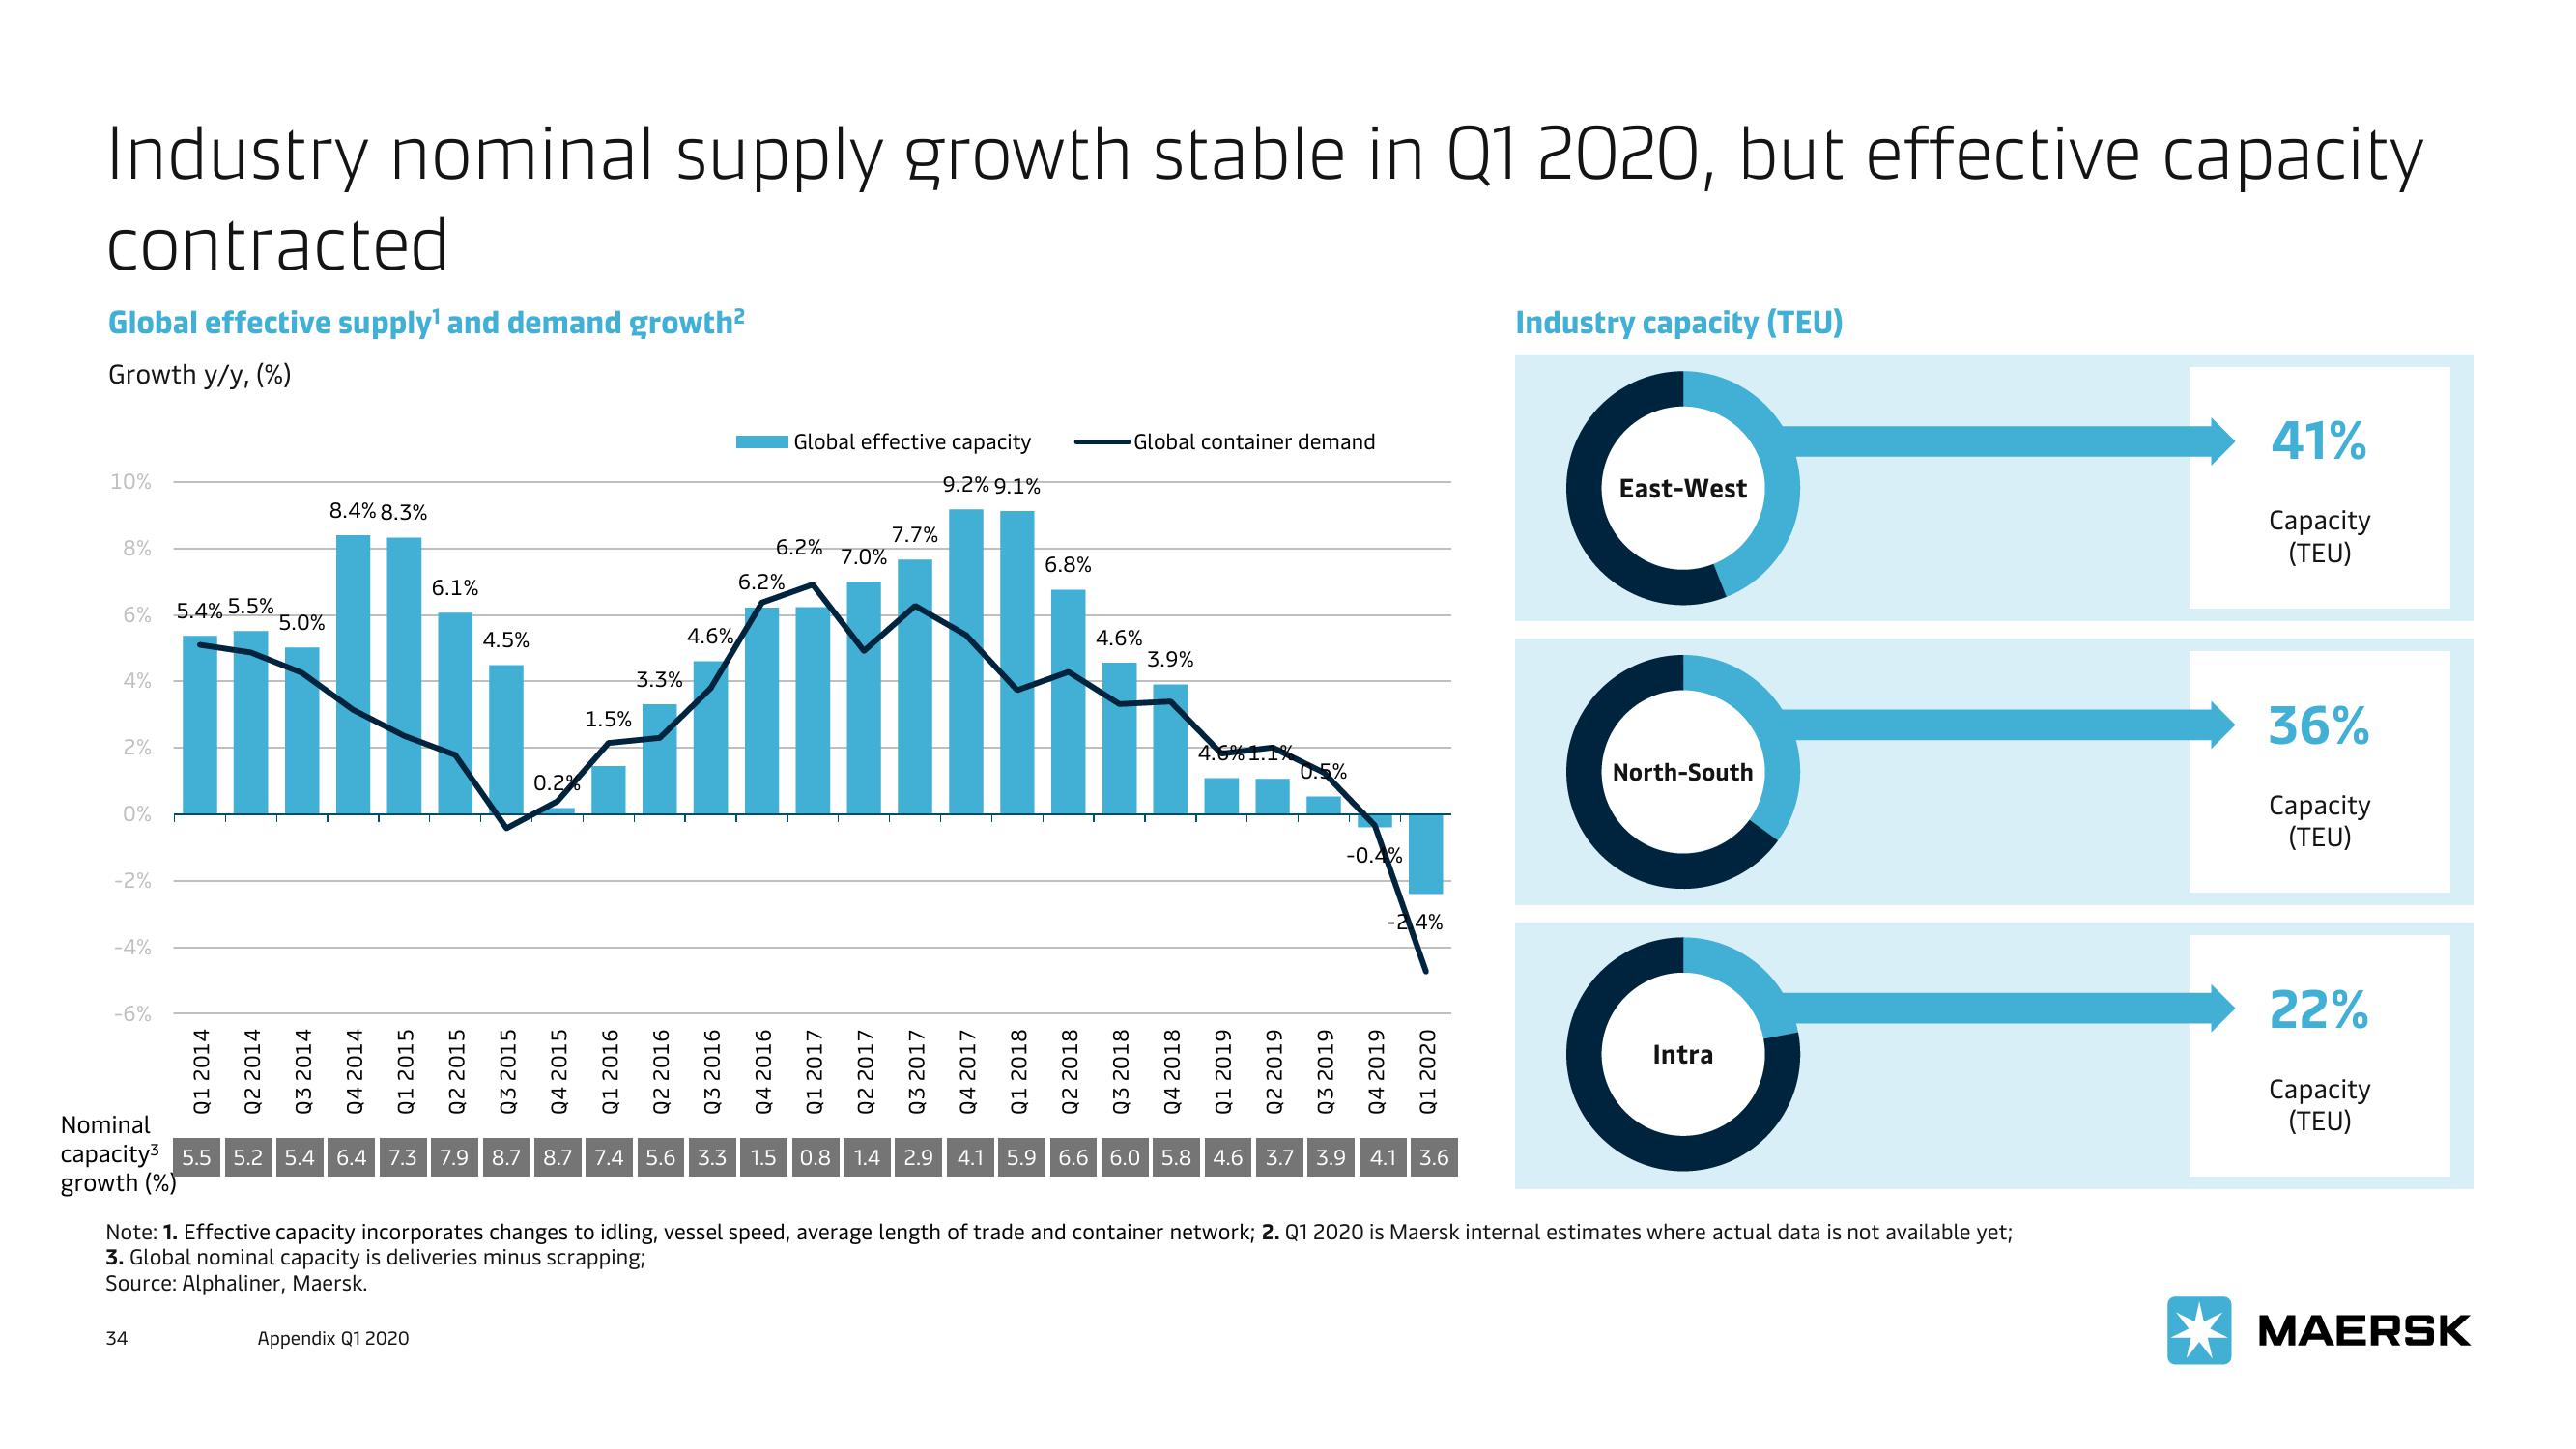
Industry nominal supply growth stable in Q1 2020, but effective capacity
contracted
Global effective supply and demand growth²
Growth y/y, (%)
10%
8%
6%
4%
2%
0%
-2%
-4%
-6%
5.4% 5.5%
Q1 2014
34
Q2 2014
5.0%
Q3 2014
8.4% 8.3%
Q4 2014
Q1 2015
6.1%
4.5%
Appendix Q1 2020
Q2 2015
Q3 2015
0.2%
Q4 2015
1.5%
9102 TO
3.3%
4.6%
6.2%
Q2 2016
Q3 2016
Q4 2016
Global effective capacity
9.2% 9.1%
6.2%
Q1 2017
7.0%
Q2 2017
7.7%
Q3 2017
Q4 2017
Q1 2018
6.8%
Q2 2018
Global container demand
4.6%
3.9%
Q3 2018
Q4 2018
Q1 2019
Q2 2019
0.5%
Q3 2019
Nominal
capacity3 5.5 5.2 5.4 6.4 7.3 7.9 8.7 8.7 7.4 5.6 3.3 1.5 0.8 1.4 2.9 4.1 5.9 6.6 6.0 5.8 4.6 3.7 3.9
growth (%)
M
-0.4%
Q4 2019
-24%
Q1 2020
4.1 3.6
Industry capacity (TEU)
DOO
East-West
North-South
Note: 1. Effective capacity incorporates changes to idling, vessel speed, average length of trade and container network; 2. Q1 2020 is Maersk internal estimates where actual data is not available yet;
3. Global nominal capacity is deliveries minus scrapping;
Source: Alphaliner, Maersk.
Intra
41%
Capacity
(TEU)
36%
Capacity
(TEU)
22%
Capacity
(TEU)
MAERSKView entire presentation