Sonos Results Presentation Deck
Making Progress to Rightsize Inventories
Finished goods
% y/y
% q/q
Components
% y/y
% q/q
Inventories
% y/y
% q/q
4Q22
$ 406,657
163%
57%
$ 47,631
56%
(38)%
$ 454,288
145%
35%
3Q23
$ 240,117
(7)%
(13)%
$ 58,029
(24)%
12%
$ 298,146
(11)%
(9)%
Note: $ in thousands (unless noted), unaudited.
Percentages have been calculated using actual, non-rounded figures and, therefore, may not recalculate precisely.
4Q23
$ 281,571
(31)%
17%
$ 64,950
36%
12%
$ 346,521
(24)%
16%
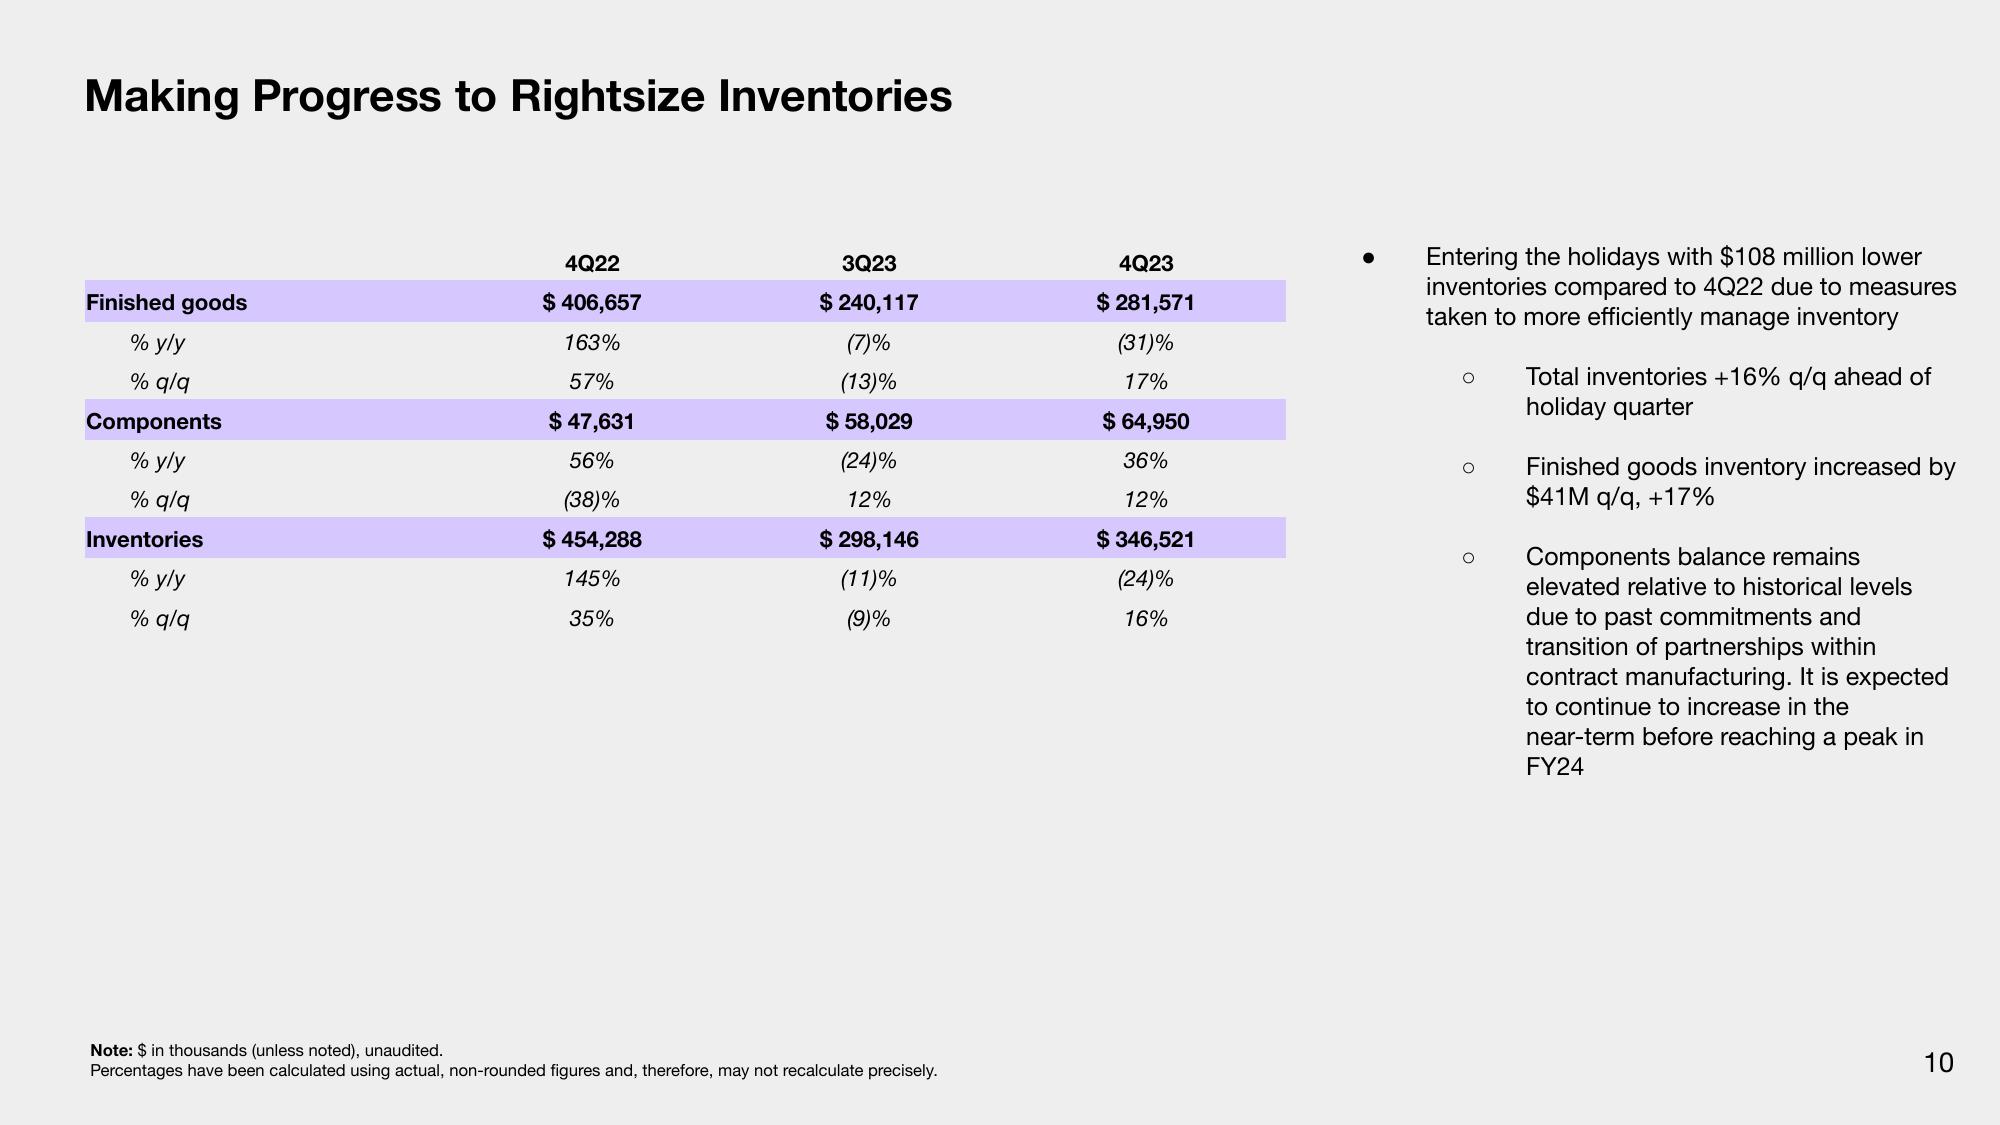
Entering the holidays with $108 million lower
inventories compared to 4Q22 due to measures
taken to more efficiently manage inventory
O
Total inventories +16% q/q ahead of
holiday quarter
Finished goods inventory increased by
$41M q/q, +17%
Components balance remains
elevated relative to historical levels
due to past commitments and
transition of partnerships within
contract manufacturing. It is expected
to continue to increase in the
near-term before reaching a peak in
FY24
10View entire presentation