Otonomo SPAC Presentation Deck
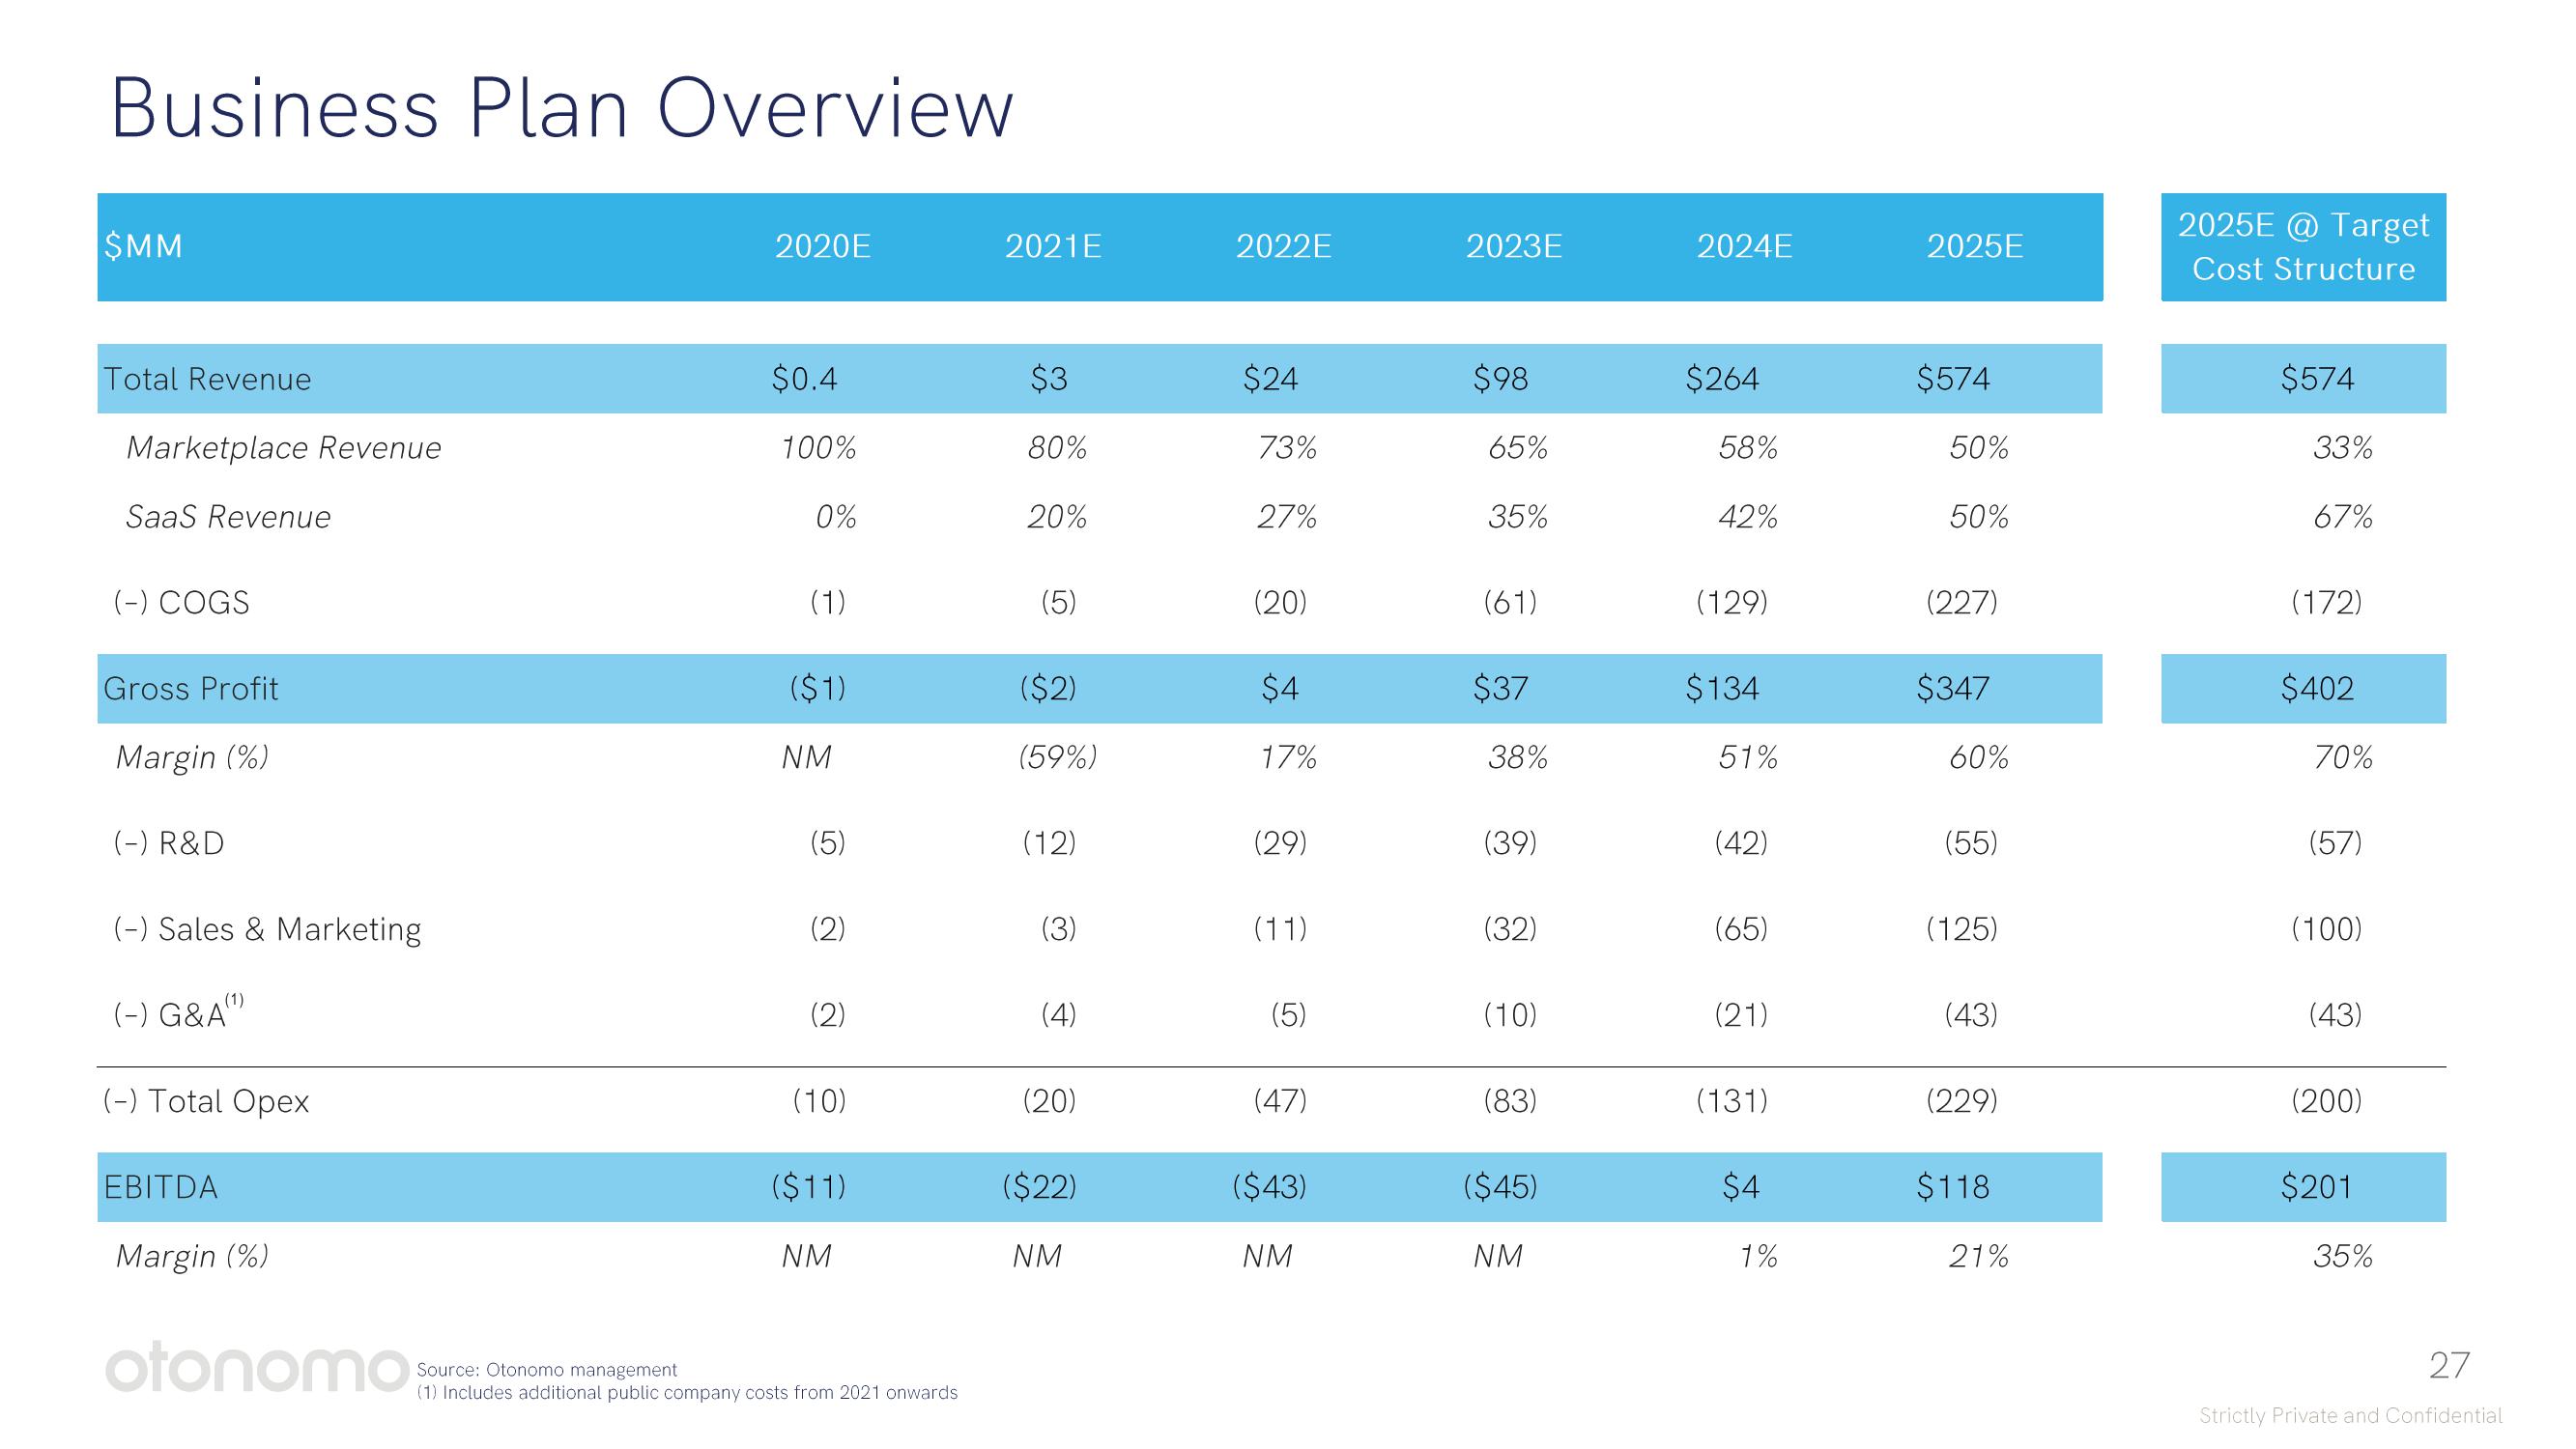
Business Plan Overview
$MM
Total Revenue
Marketplace venue
SaaS Revenue
(-) COGS
Gross Profit
Margin (%)
(-) R&D
(-) Sales & Marketing
(1)
(-) G&A¹)
(-) Total Opex
EBITDA
Margin (%)
otonomo
2020E
$0.4
100%
0%
(1)
($1)
NM
(5)
(2)
(10)
($11)
NM
Source: Otonomo management
(1) Includes additional public company costs from 2021 onwards
2021E
$3
80%
20%
(5)
($2)
(59%)
(12)
(3)
(4)
(20)
($22)
NM
2022E
$24
73%
27%
(20)
$4
17%
(29)
(11)
(5)
(47)
($43)
NM
2023E
$98
65
35%
(61)
$37
38%
(39)
(32)
(10)
(83)
($45)
NM
2024E
$264
8%
42%
(129)
$134
51%
(42)
(65)
(21)
(131)
$4
1%
2025E
$574
50%
50%
(227)
$347
60%
(55)
(125)
(43)
(229)
$118
21%
2025E @Target
Cost Structure
$574
33%
67%
(172)
$402
70%
(57)
(100)
(43)
(200)
$201
35%
27
Strictly Private and ConfidentialView entire presentation