Paycor Investor Presentation Deck slide image

Paycor Investor Presentation Deck

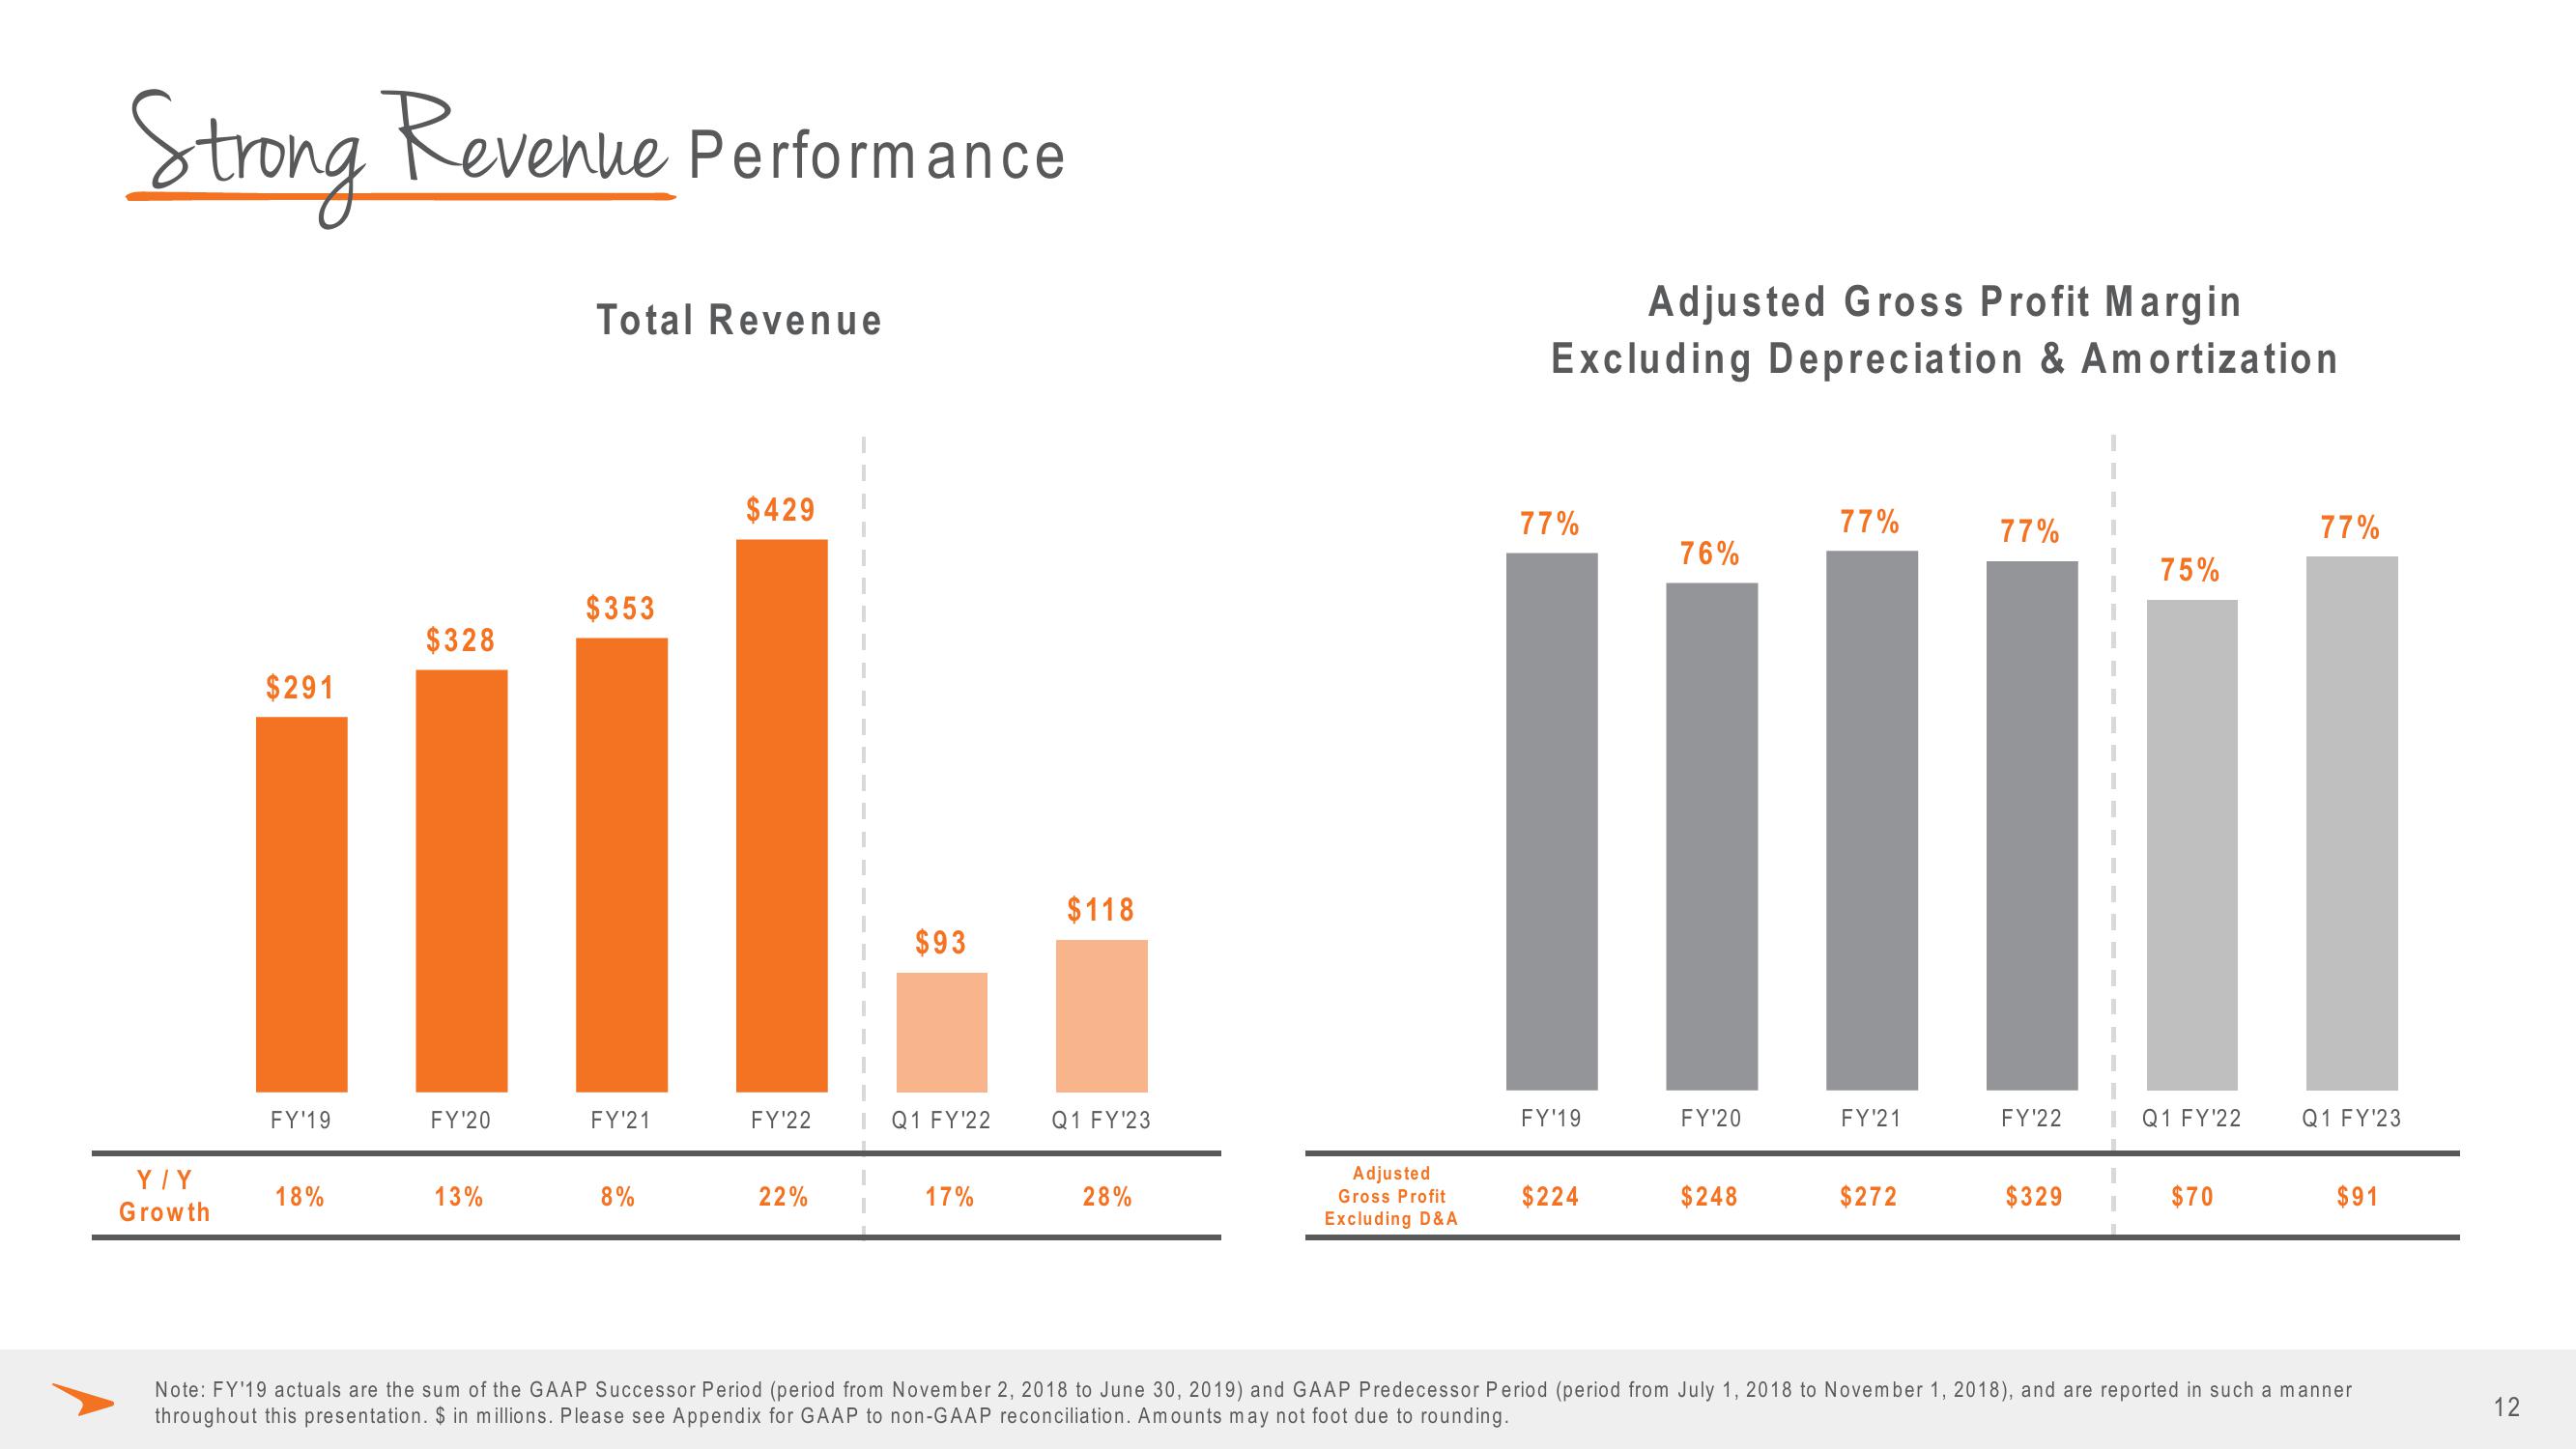
Strong Revenue Performance Y/Y Growth $291 FY¹19 18% $328 Total Revenue 13% $353 FY'20 FY'21 FY'22 $429 8% 22% $93 Q1 FY'22 17% $118 Q1 FY¹23 28% Adjusted Gross Profit Excluding D&A Adjusted Gross Profit Margin Excluding Depreciation & Amortization 77% 76% $224 77% FY'19 FY'20 FY'21 FY'22 $248 77% $272 $329 75% 1 Q1 FY'22 $70 77% Q1 FY¹23 $91 Note: FY¹19 actuals are the sum of the GAAP Successor Period (period from November 2, 2018 to June 30, 2019) and GAAP Predecessor Period (period from July 1, 2018 to November 1, 2018), and are reported in such a manner throughout this presentation. $ in millions. Please see Appendix for GAAP to non-GAAP reconciliation. Amounts may not foot due to rounding. 12
View entire presentation