HPS Specialty Loan Fund VI
HPS Specialty Loan Fund V
Portfolio Diversification
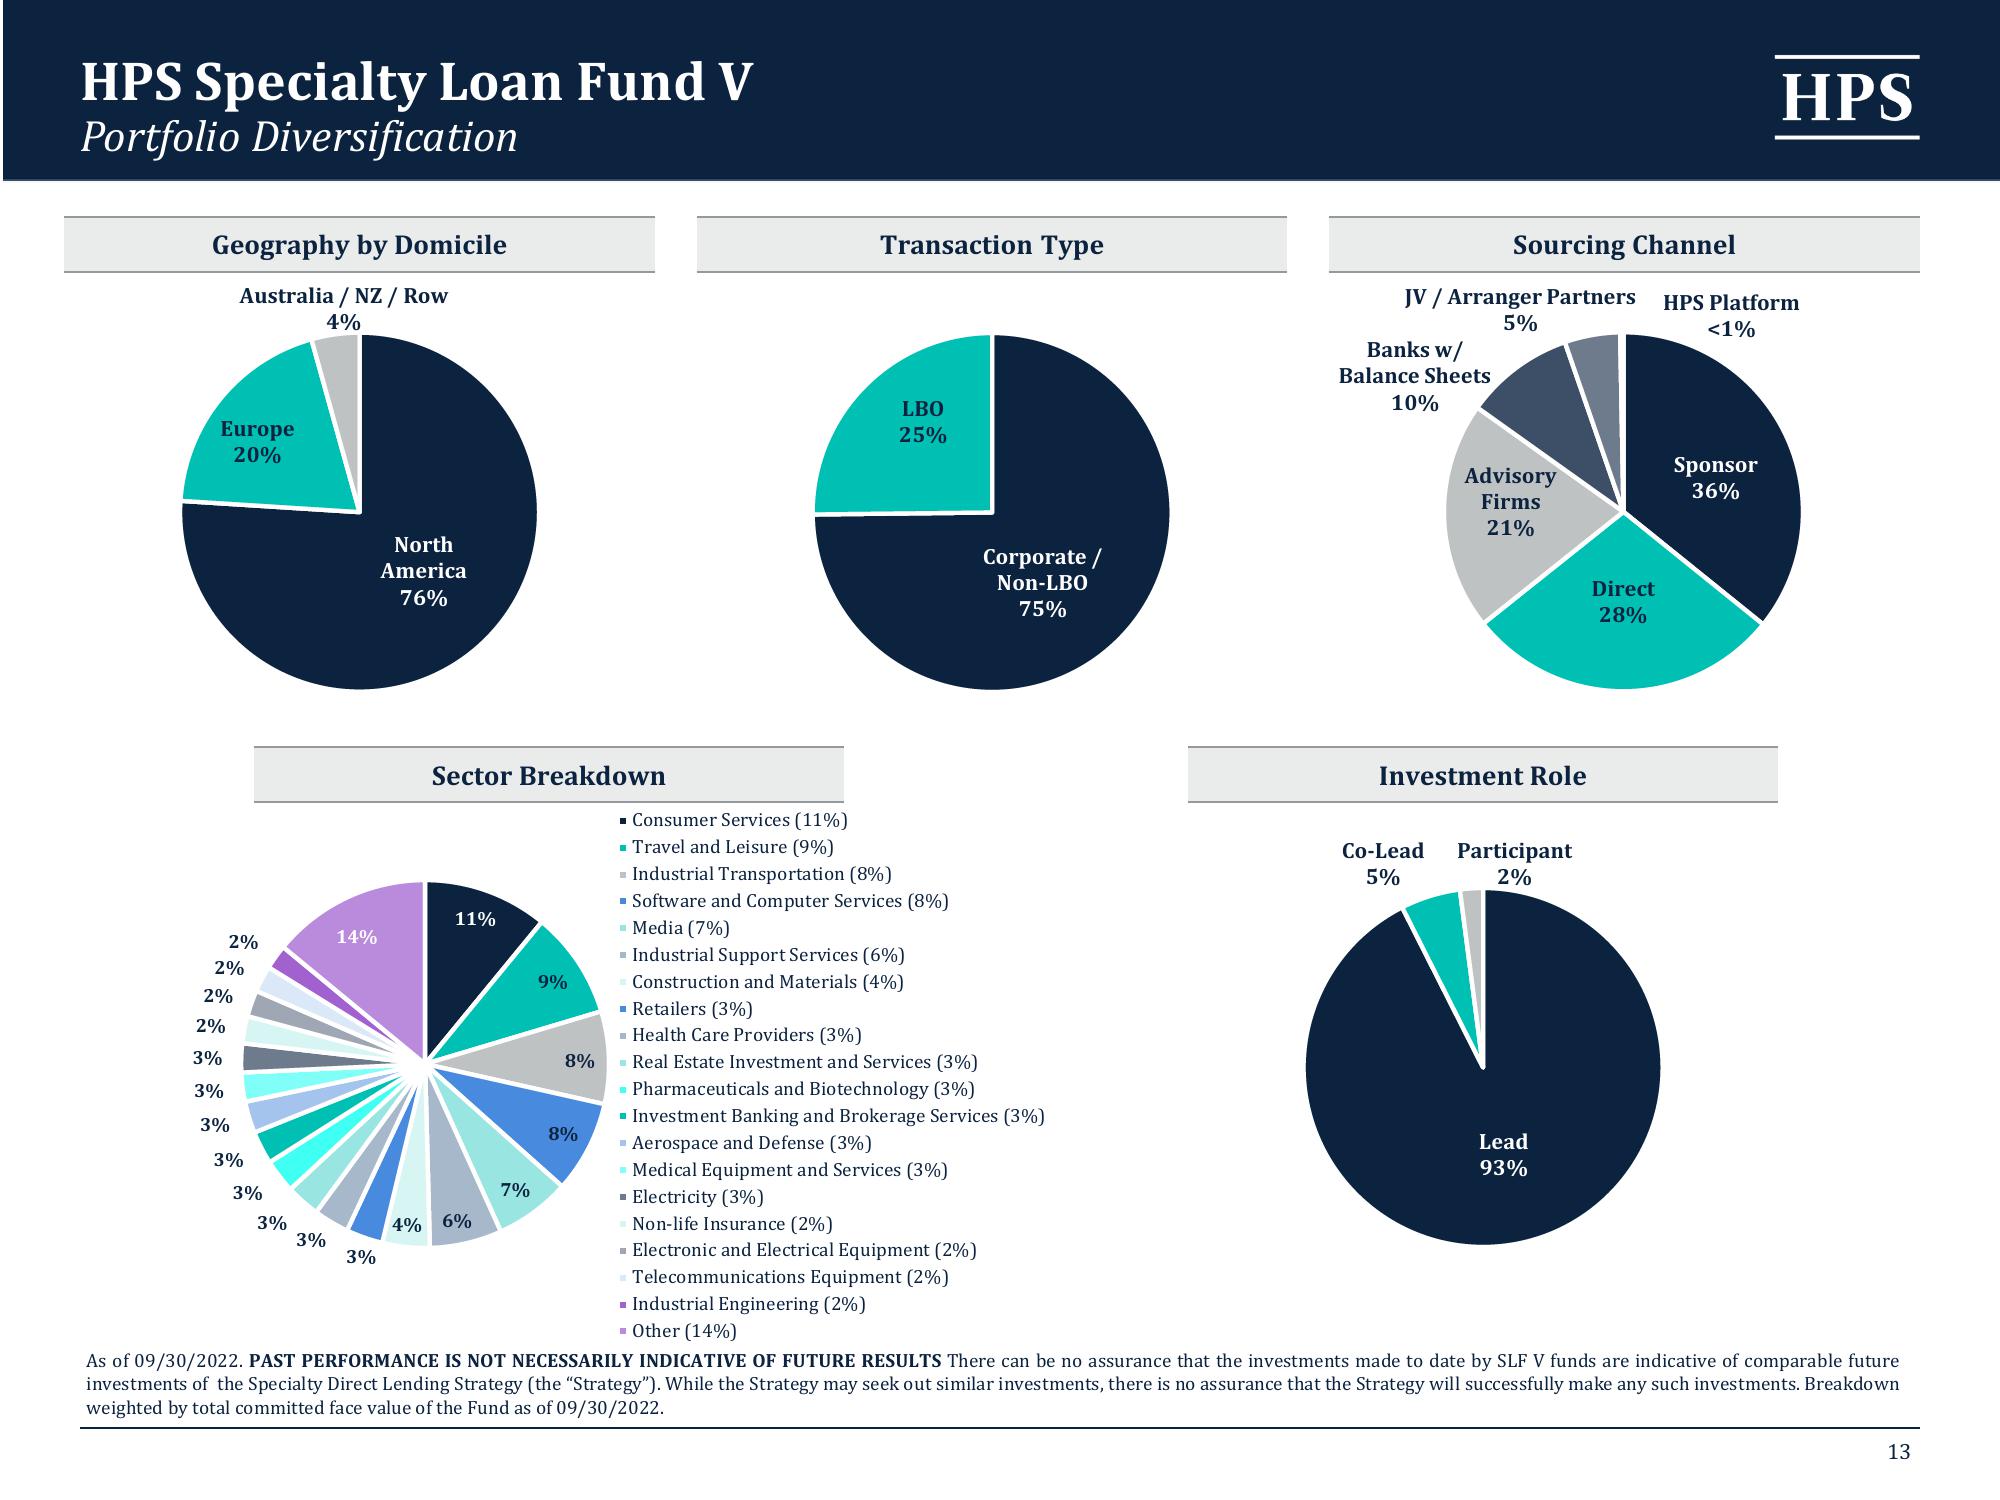
Geography by Domicile
Australia / NZ / Row
4%
Europe
20%
2%
2%
2%
2%
3%
3%
3%
3%
3%
3%
3%
14%
3%
North
America
76%
Sector Breakdown
11%
4% 6%
7%
9%
8%
8%
Transaction Type
LBO
25%
■ Consumer Services (11%)
Travel and Leisure (9%)
Industrial Transportation (8%)
▪ Software and Computer Services (8%)
- Media (7%)
- Industrial Support Services (6%)
Construction and Materials (4%)
▪ Retailers (3%)
Health Care Providers (3%)
- Real Estate Investment and Services (3%)
▪ Pharmaceuticals and Biotechnology (3%)
Corporate /
Non-LBO
75%
▪ Investment Banking and Brokerage Services (3%)
▪ Aerospace and Defense (3%)
- Medical Equipment and Services (3%)
▪ Electricity (3%)
Non-life Insurance (2%)
- Electronic and Electrical Equipment (2%)
Telecommunications Equipment (2%)
■ Industrial Engineering (2%)
- Other (14%)
Sourcing Channel
JV / Arranger Partners HPS Platform
5%
<1%
Banks w/
Balance Sheets
10%
Advisory
Firms
21%
Investment Role
Co-Lead Participant
5%
2%
Lead
93%
Direct
28%
HPS
Sponsor
36%
As of 09/30/2022. PAST PERFORMANCE IS NOT NECESSARILY INDICATIVE OF FUTURE RESULTS There can be no assurance that the investments made to date by SLF V funds are indicative of comparable future
investments of the Specialty Direct Lending Strategy (the "Strategy"). While the Strategy may seek out similar investments, there is no assurance that the Strategy will successfully make any such investments. Breakdown
weighted by total committed face value of the Fund as of 09/30/2022.
13View entire presentation