J.P.Morgan Investment Banking Pitch Book
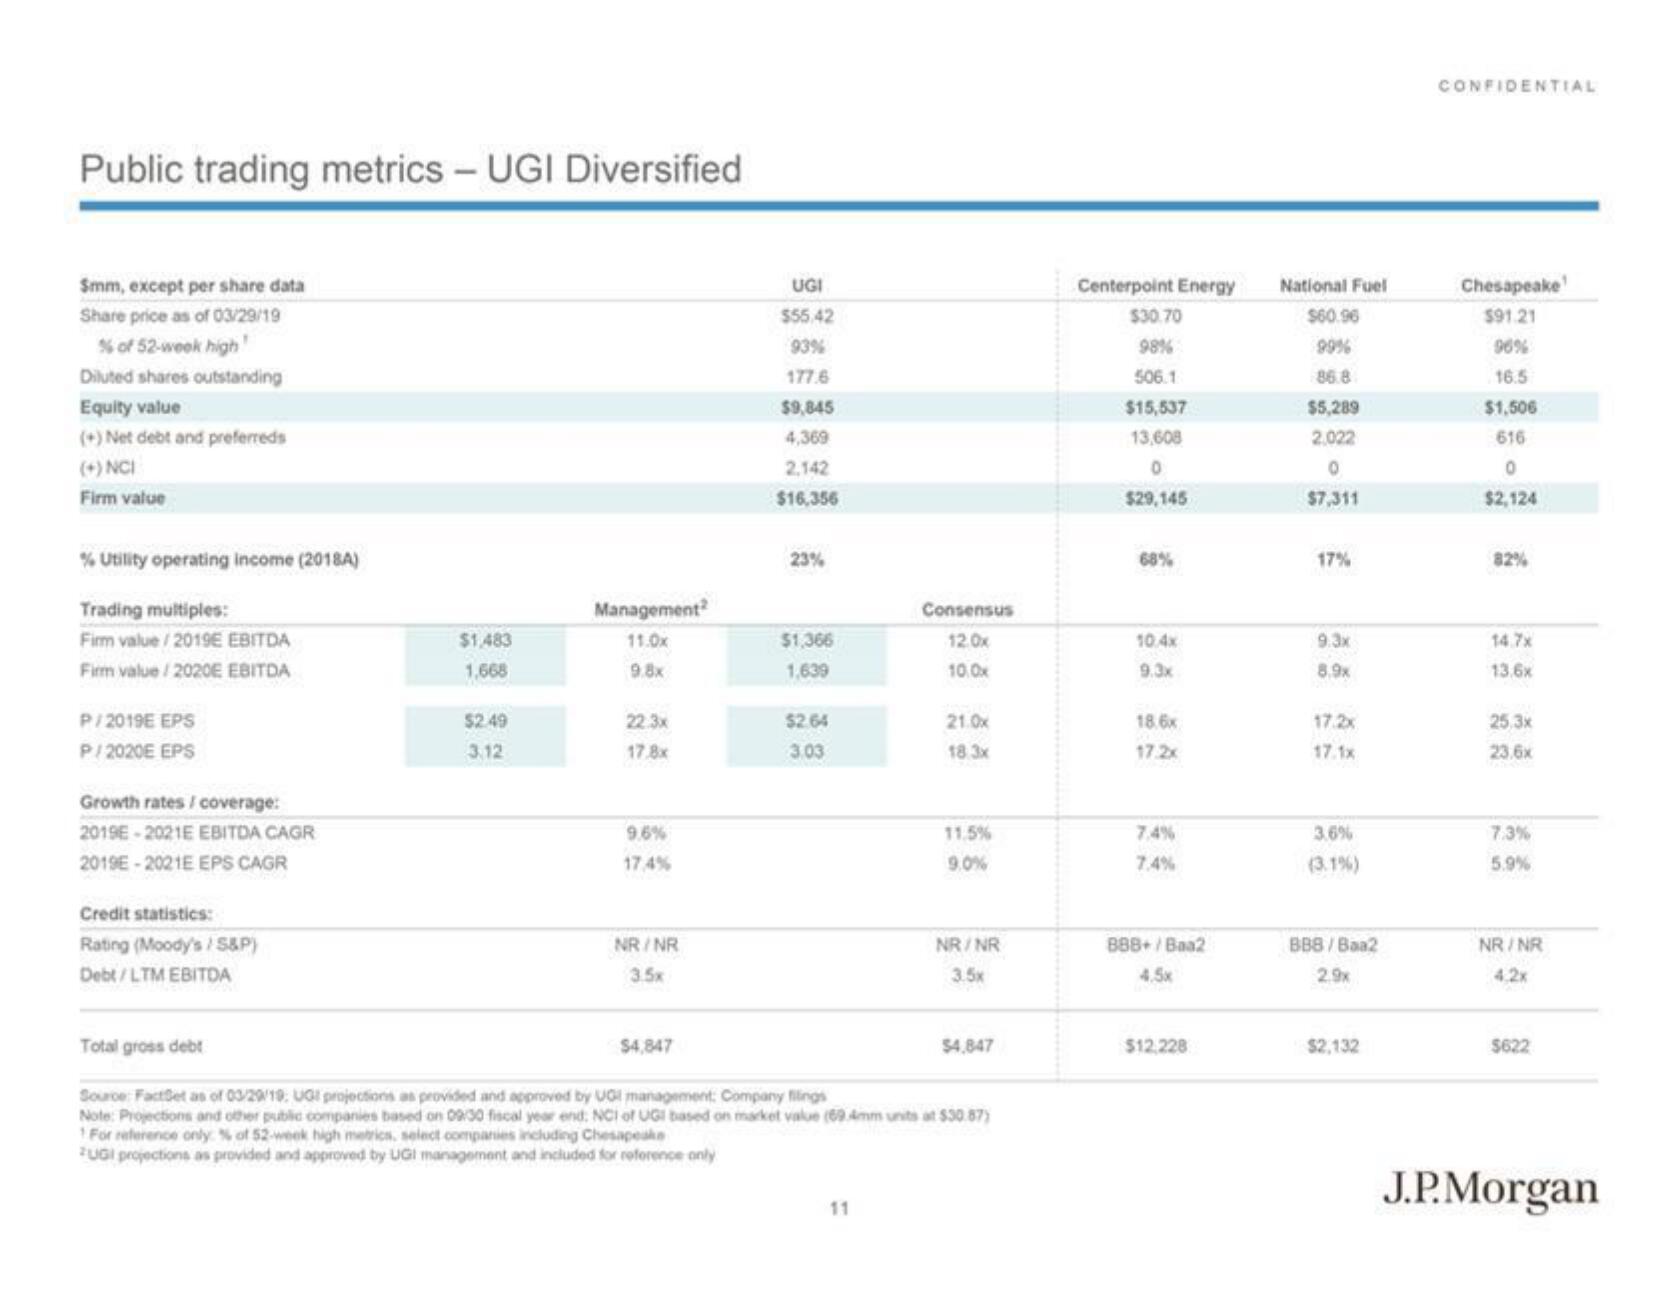
Public trading metrics - UGI Diversified
Smm, except per share data
Share price as of 03/29/19
% of 52-week high!
Diluted shares outstanding
Equity value
(+) Net debt and preferreds
(+) NCI
Firm value
% Utility operating income (2018A)
Trading multiples:
Firm value/2019E EBITDA
Firm value/2020E EBITDA
P/2019E EPS
P/2020E EPS
Growth rates / coverage:
2019E-2021E EBITDA CAGR
2019E-2021E EPS CAGR
Credit statistics:
Rating (Moody's/S&P)
Debt/LTM EBITDA
$1,483
1,668
$2.49
3.12
Management
11.0x
9.8x
22.3x
17.8x
9.6%
17.4%
NR/NR
3.5x
$4,847
UGI
$55.42
93%
177.6
$9,845
4,369
2,142
$16,356
23%
$1,366
1.639
$2.64
3.03
Consensus
12.0x
10.0x
11
21.0x
18.3x
11.5%
9.0%
Total gross debt
Source: FactSet as of 03/29/19. UGI projections as provided and approved by UGI management Company filings
Note: Projections and other public companies based on 09:30 fiscal year end. NOI of UGI based on market value (69.4mm units at $30.87)
For reference only % of 52-week high metrics, select companies including Chesapeake
FUGI projections as provided and approved by UGI management and included for reference only
NR/NR
3.5x
$4,847
Centerpoint Energy
$30.70
98%
506.1
$15,537
13,608
0
$29,145
68%
10.4x
9.3x
18.6x
17.2x
7.4%
7.4%
888+/Baa2
4.5x
$12,228
National Fuel
$60.96
99%
86.8
$5,289
2.022
0
$7,311
17%
9.3x
8.9x
17.1x
3.6%
(3.1%)
BB8/Baa2
2.9x
$2,132
CONFIDENTIAL
Chesapeake
$91.21
96%
16.5
$1,506
616
0
$2,124
82%
14.7x
13.6x
25.3x
23,6x
7.3%
5.9%
NR/NR
4.2x
$622
J.P. MorganView entire presentation