UBS Results Presentation Deck
Personal & Corporate Banking (CHF)
Total revenues,
m
1,002
Profit before tax,
m
395
+18% 7
1Q22
+40%
1,180
553
1Q23
CHFm, except where indicated
Total revenues
Net interest income
Recurring net fee income
Transaction-based income
Other income
Credit loss expense / (release)
Operating expenses
Profit before tax
Cost / income ratio
Return on attributed equity
Investment products¹, bn
Deposits, bn
Loans, bn
UBS Balances as of quarter-end; 1 In Personal Banking
1Q23 4Q22 1Q22 QoQ
1,180
651
210
309
10
14
613
553
52%
25%
23
165
144
1,079 1,002 +9% +18%
493 +8% +32%
603
193
210 +8%
300 +15%
(1)
269
13
(3)
578
504
54%
22%
22
167
143
58% (2pp)
18%
YoY
21
586 +6% +5%
395 +10% +40%
23 +5%
162 (1%)
141 +1%
0%
+3%
(7pp)
(2%)
+2%
+2%
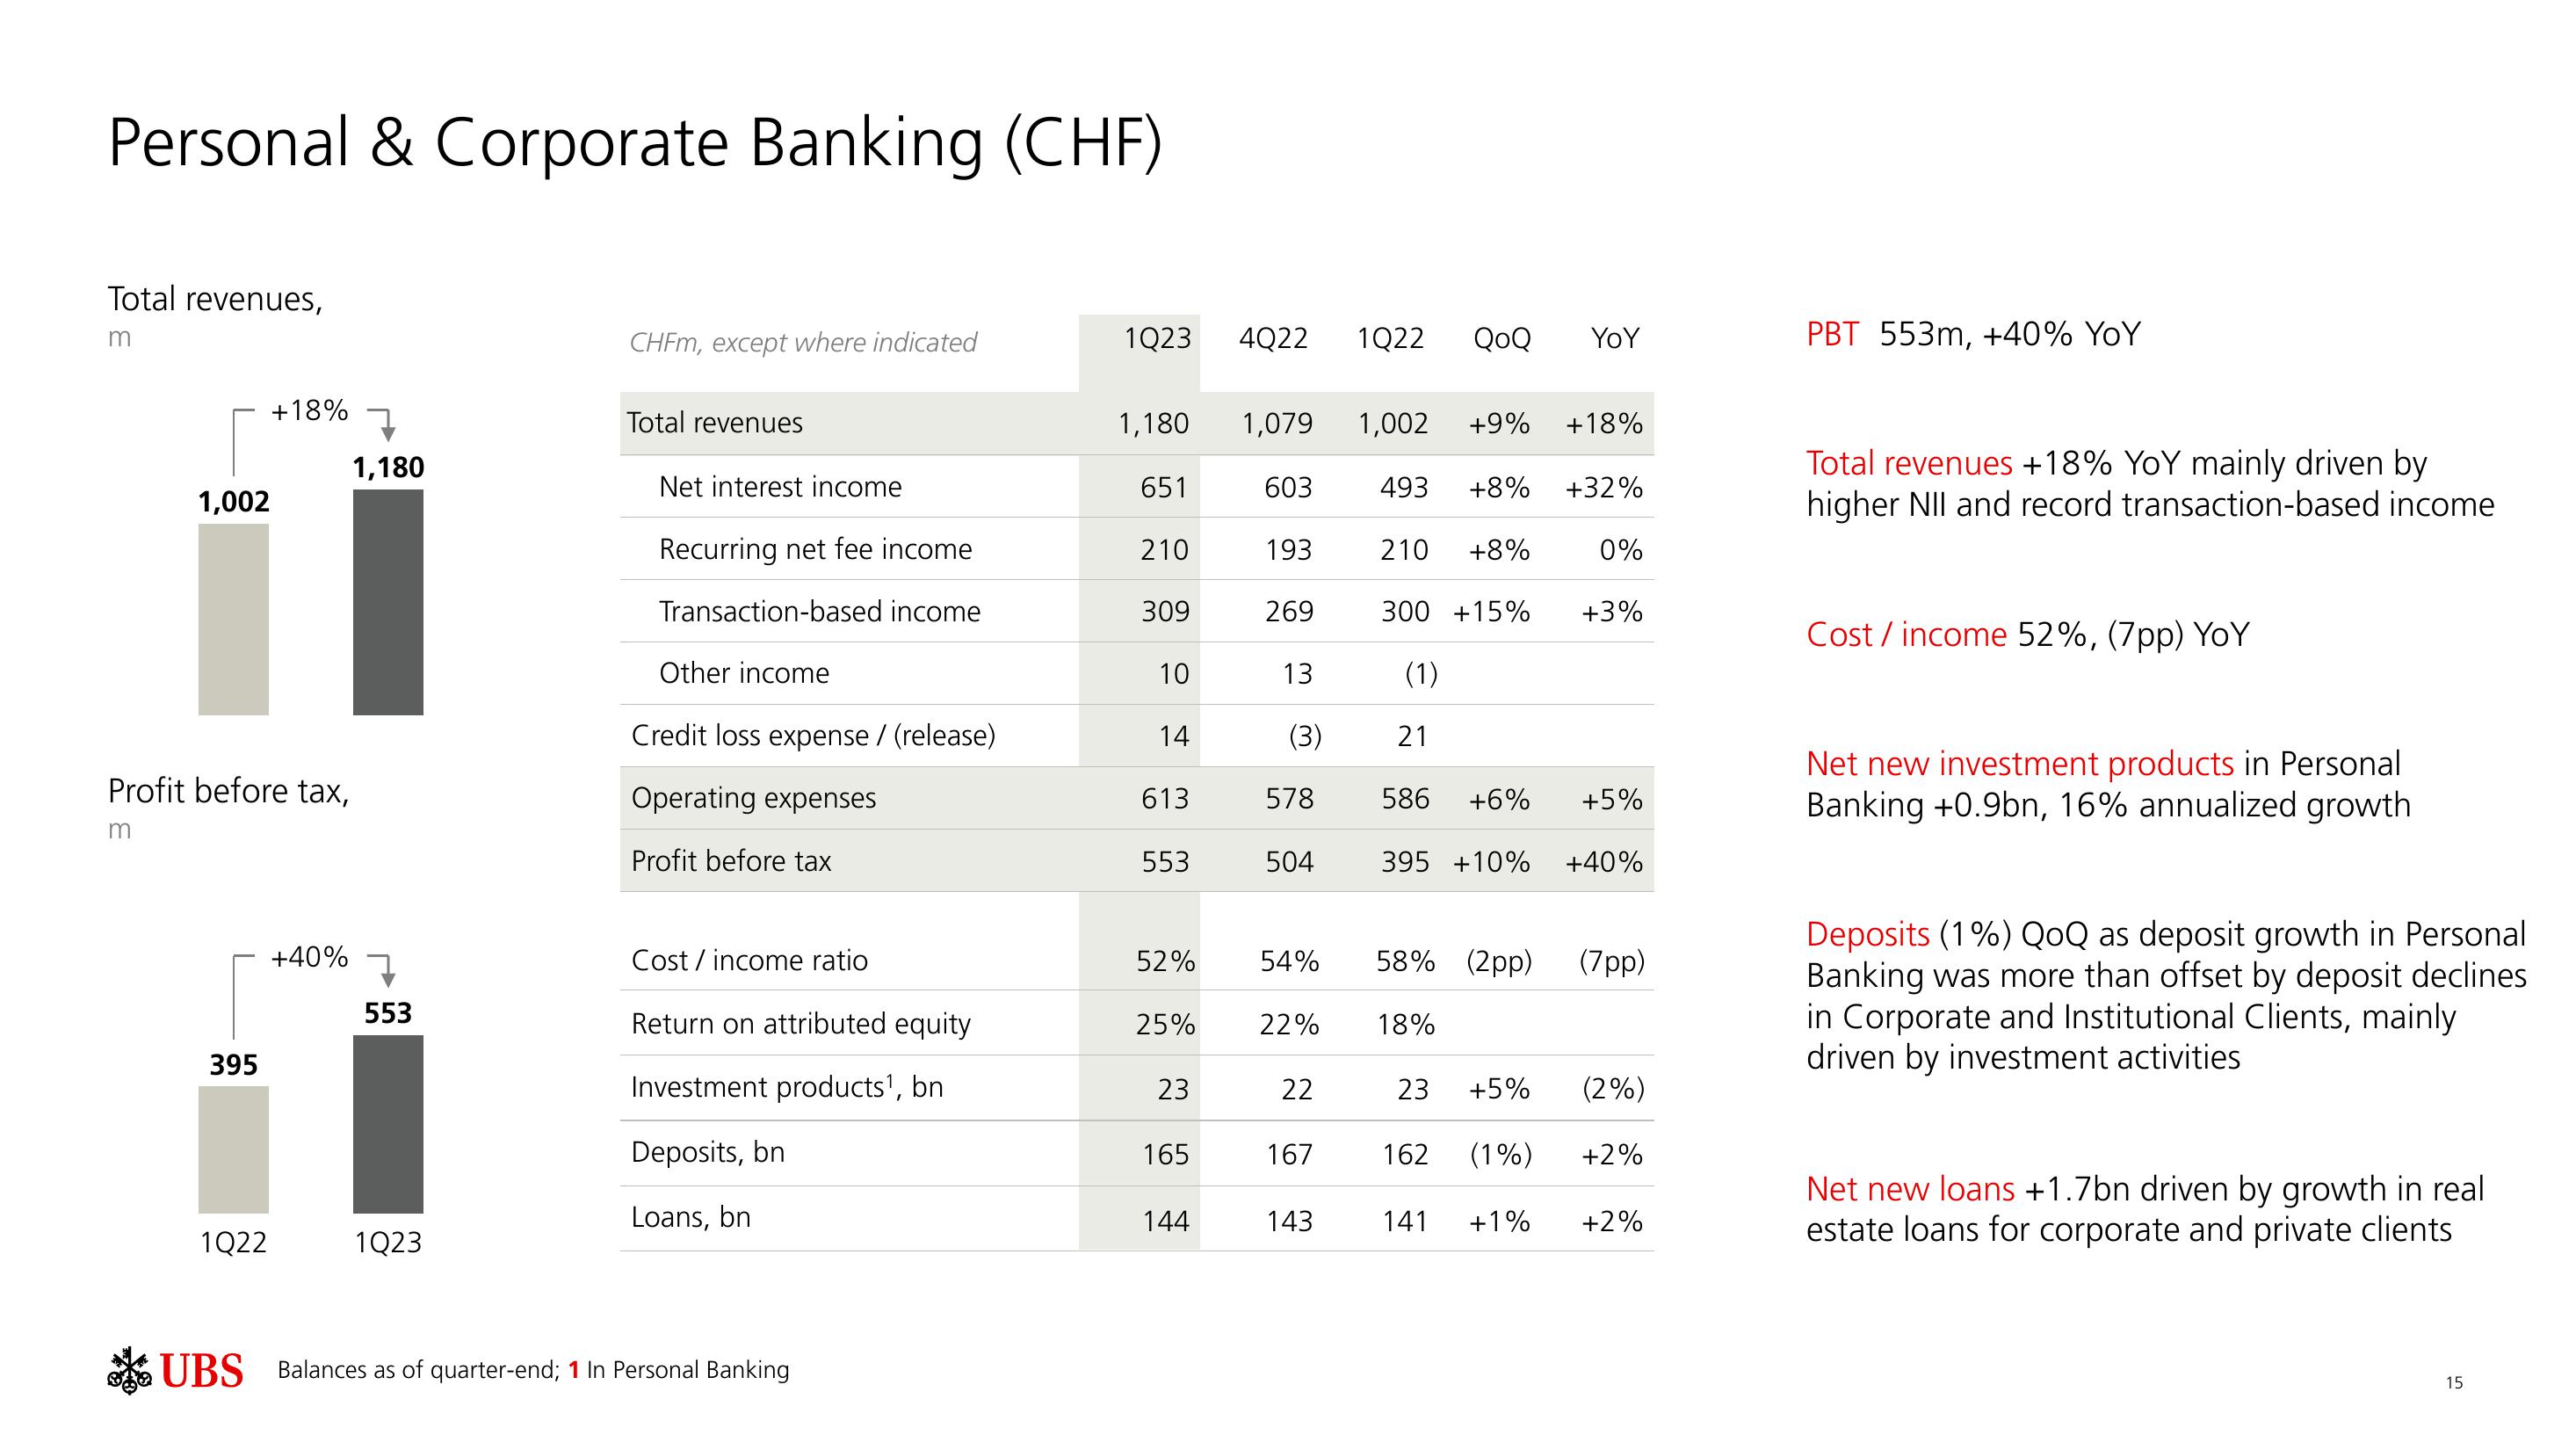
PBT 553m, +40% YoY
Total revenues +18% YoY mainly driven by
higher NII and record transaction-based income
Cost / income 52%, (7pp) YoY
Net new investment products in Personal
Banking +0.9bn, 16% annualized growth
Deposits (1%) QoQ as deposit growth in Personal
Banking was more than offset by deposit declines
in Corporate and Institutional Clients, mainly
driven by investment activities
Net new loans +1.7bn driven by growth in real
estate loans for corporate and private clients
15View entire presentation