Wix Results Presentation Deck
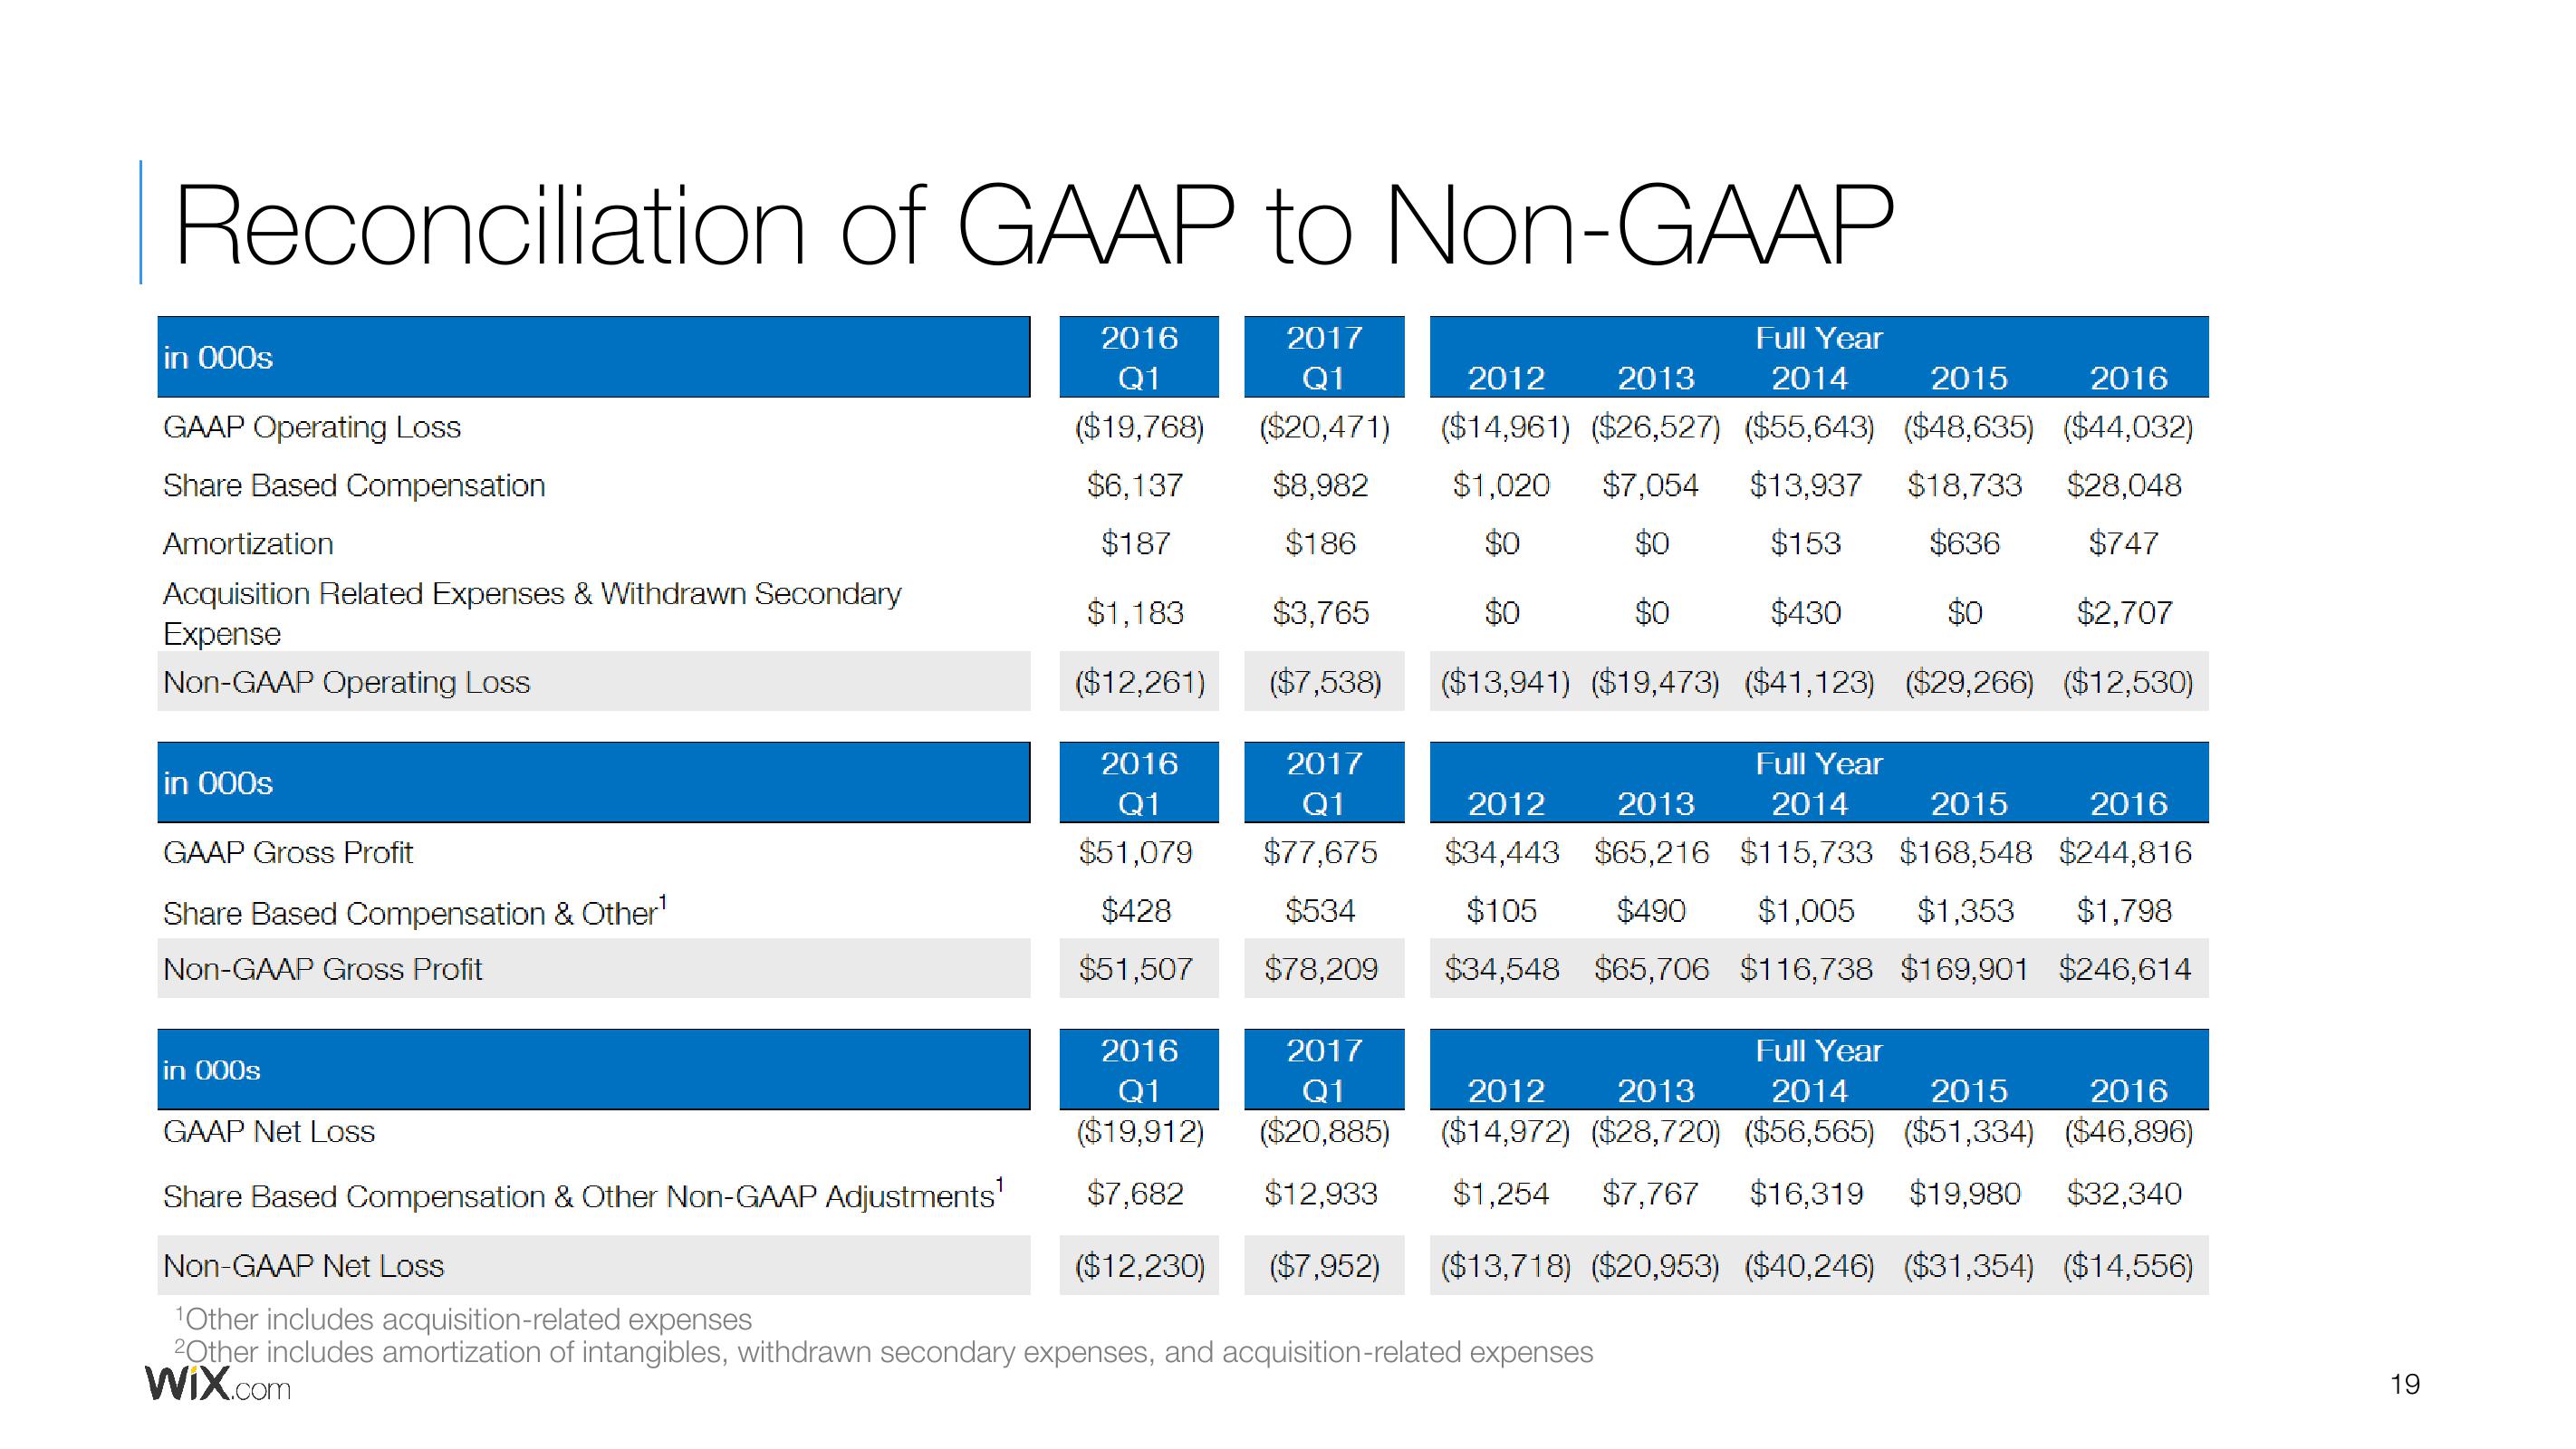
Reconciliation of GAAP to Non-GAAP
in 000s
GAAP Operating Loss
Share Based Compensation
Amortization
Acquisition Related Expenses & Withdrawn Secondary
Expense
Non-GAAP Operating Loss
in 000s
GAAP Gross Profit
Share Based Compensation & Other¹
Non-GAAP Gross Profit
in 000s
GAAP Net Loss
Share Based Compensation & Other Non-GAAP Adjustments¹
2016
2017
Q1
Q1
($19,768) ($20,471)
$6,137
$8,982
$186
$187
$1,183
$3,765
($12,261)
($7,538)
2016
Q1
$51,079
$428
$51,507
2017
Q1
$77,675
$534
$78,209
2016
Q1
2017
Q1
($20,885)
($19,912)
$7,682 $12,933
($12,230)
Full Year
2012 2013 2014 2015 2016
($14,961) ($26,527) ($55,643) ($48,635) ($44,032)
$1,020 $7,054 $13,937 $18,733
$28,048
$0
$0
$153
$636
$747
$0
$0
$430
$0
$2,707
($13,941) ($19,473) ($41,123) ($29,266) ($12,530)
Full Year
2012 2013 2014 2015 2016
$34,443 $65,216 $115,733 $168,548 $244,816
$105 $490 $1,005 $1,353 $1,798
$34,548 $65,706 $116,738 $169,901 $246,614
Full Year
2012 2013 2014 2015 2016
($14,972) ($28,720) ($56,565) ($51,334) ($46,896)
$1,254 $7,767 $16,319 $19,980 $32,340
($7,952) ($13,718) ($20,953) ($40,246) ($31,354) ($14,556)
Non-GAAP Net Loss
¹Other includes acquisition-related expenses
2Other includes amortization of intangibles, withdrawn secondary expenses, and acquisition-related expenses
Wix.com
19View entire presentation