Rentokil Initial Investor Day Presentation Deck
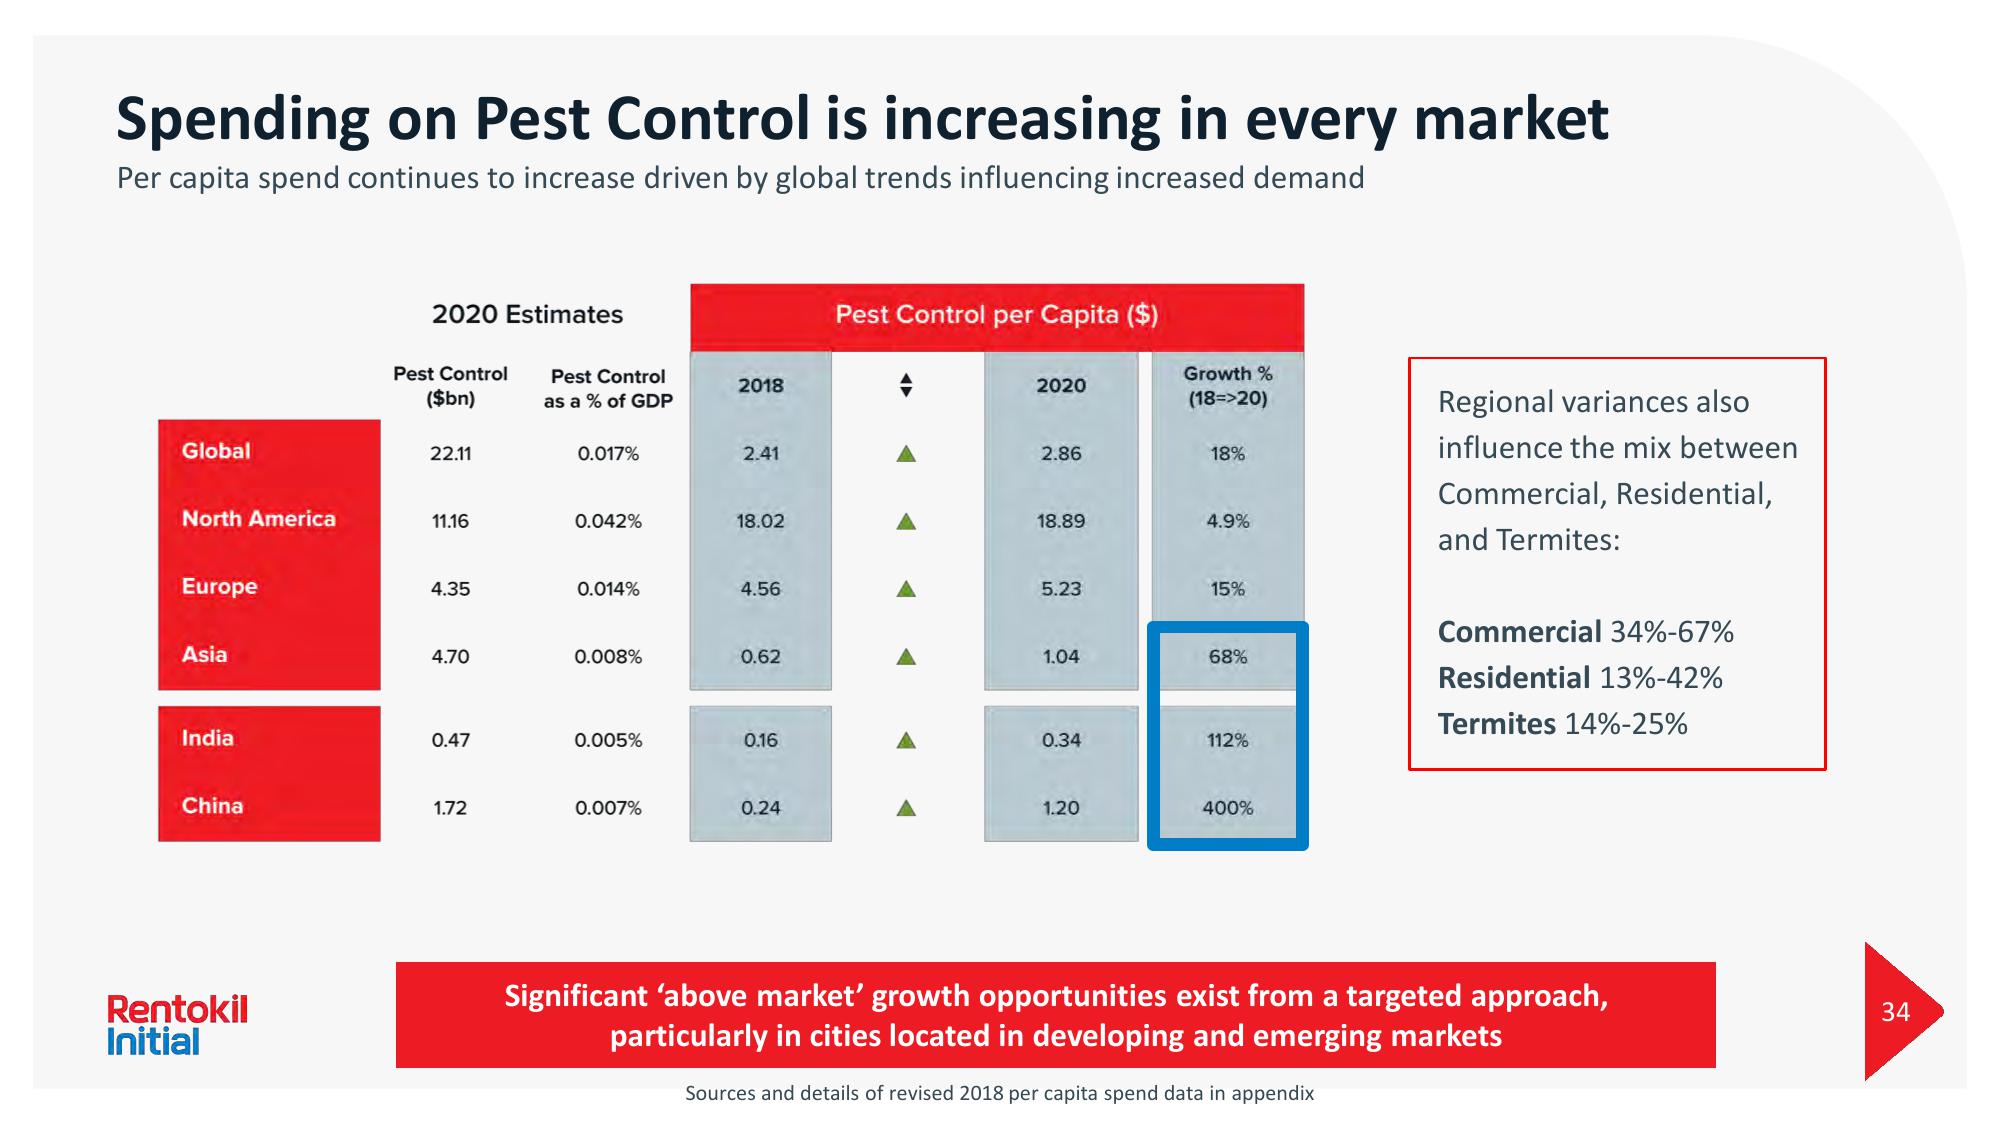
Spending on Pest Control is increasing in every market
Per capita spend continues to increase driven by global trends influencing increased demand
Global
North America
Europe
Asia
India
China
Rentokil
Initial
2020 Estimates
Pest Control
($bn)
22.11
11.16
4.35
4.70
0.47
1.72
Pest Control
as a % of GDP
0.017%
0.042%
0.014%
0.008%
0.005%
0.007%
2018
2.41
18.02
4.56
0.62
0.16
0.24
Pest Control per Capita ($)
2020
2.86
18.89
5.23
1.04
0.34
1.20
Growth %
(18=>20)
18%
4.9%
15%
68%
112%
400%
Regional variances also
influence the mix between
Commercial, Residential,
and Termites:
Commercial 34%-67%
Residential 13%-42%
Termites 14%-25%
Significant 'above market' growth opportunities exist from a targeted approach,
particularly in cities located in developing and emerging markets
Sources and details of revised 2018 per capita spend data in appendix
34View entire presentation