Q3 Performance Coatings Report
Q3 Consolidated Results
($ in millions, except
per share data)
Performance Coatings
Mobility Coatings
Net Sales
Income (loss) from ops
Adjusted EBIT
% margin
Diluted EPS
Adjusted EPS
$1,027
Financial Performance
Q3 2020
(1.6)%
2021
779
309
1,089
125
146
13.4%
Q3
0.30
0.39
683
344
1,027
142
210
20.4 %
0.35
0.59
Net Sales Variance
4.5%
2020
Volume Price/Mix
1.3%
FX
% Change
Incl. F/X
14.1%
(10.1)%
6.0 %
(12.0)%
(30.6)%
(14.3)%
(33.9)%
1.8%
Acq.
Excl. F/X
12.9 %
(11.6)%
4.7%
6.0%
$1,089
Q3 2021
Commentary
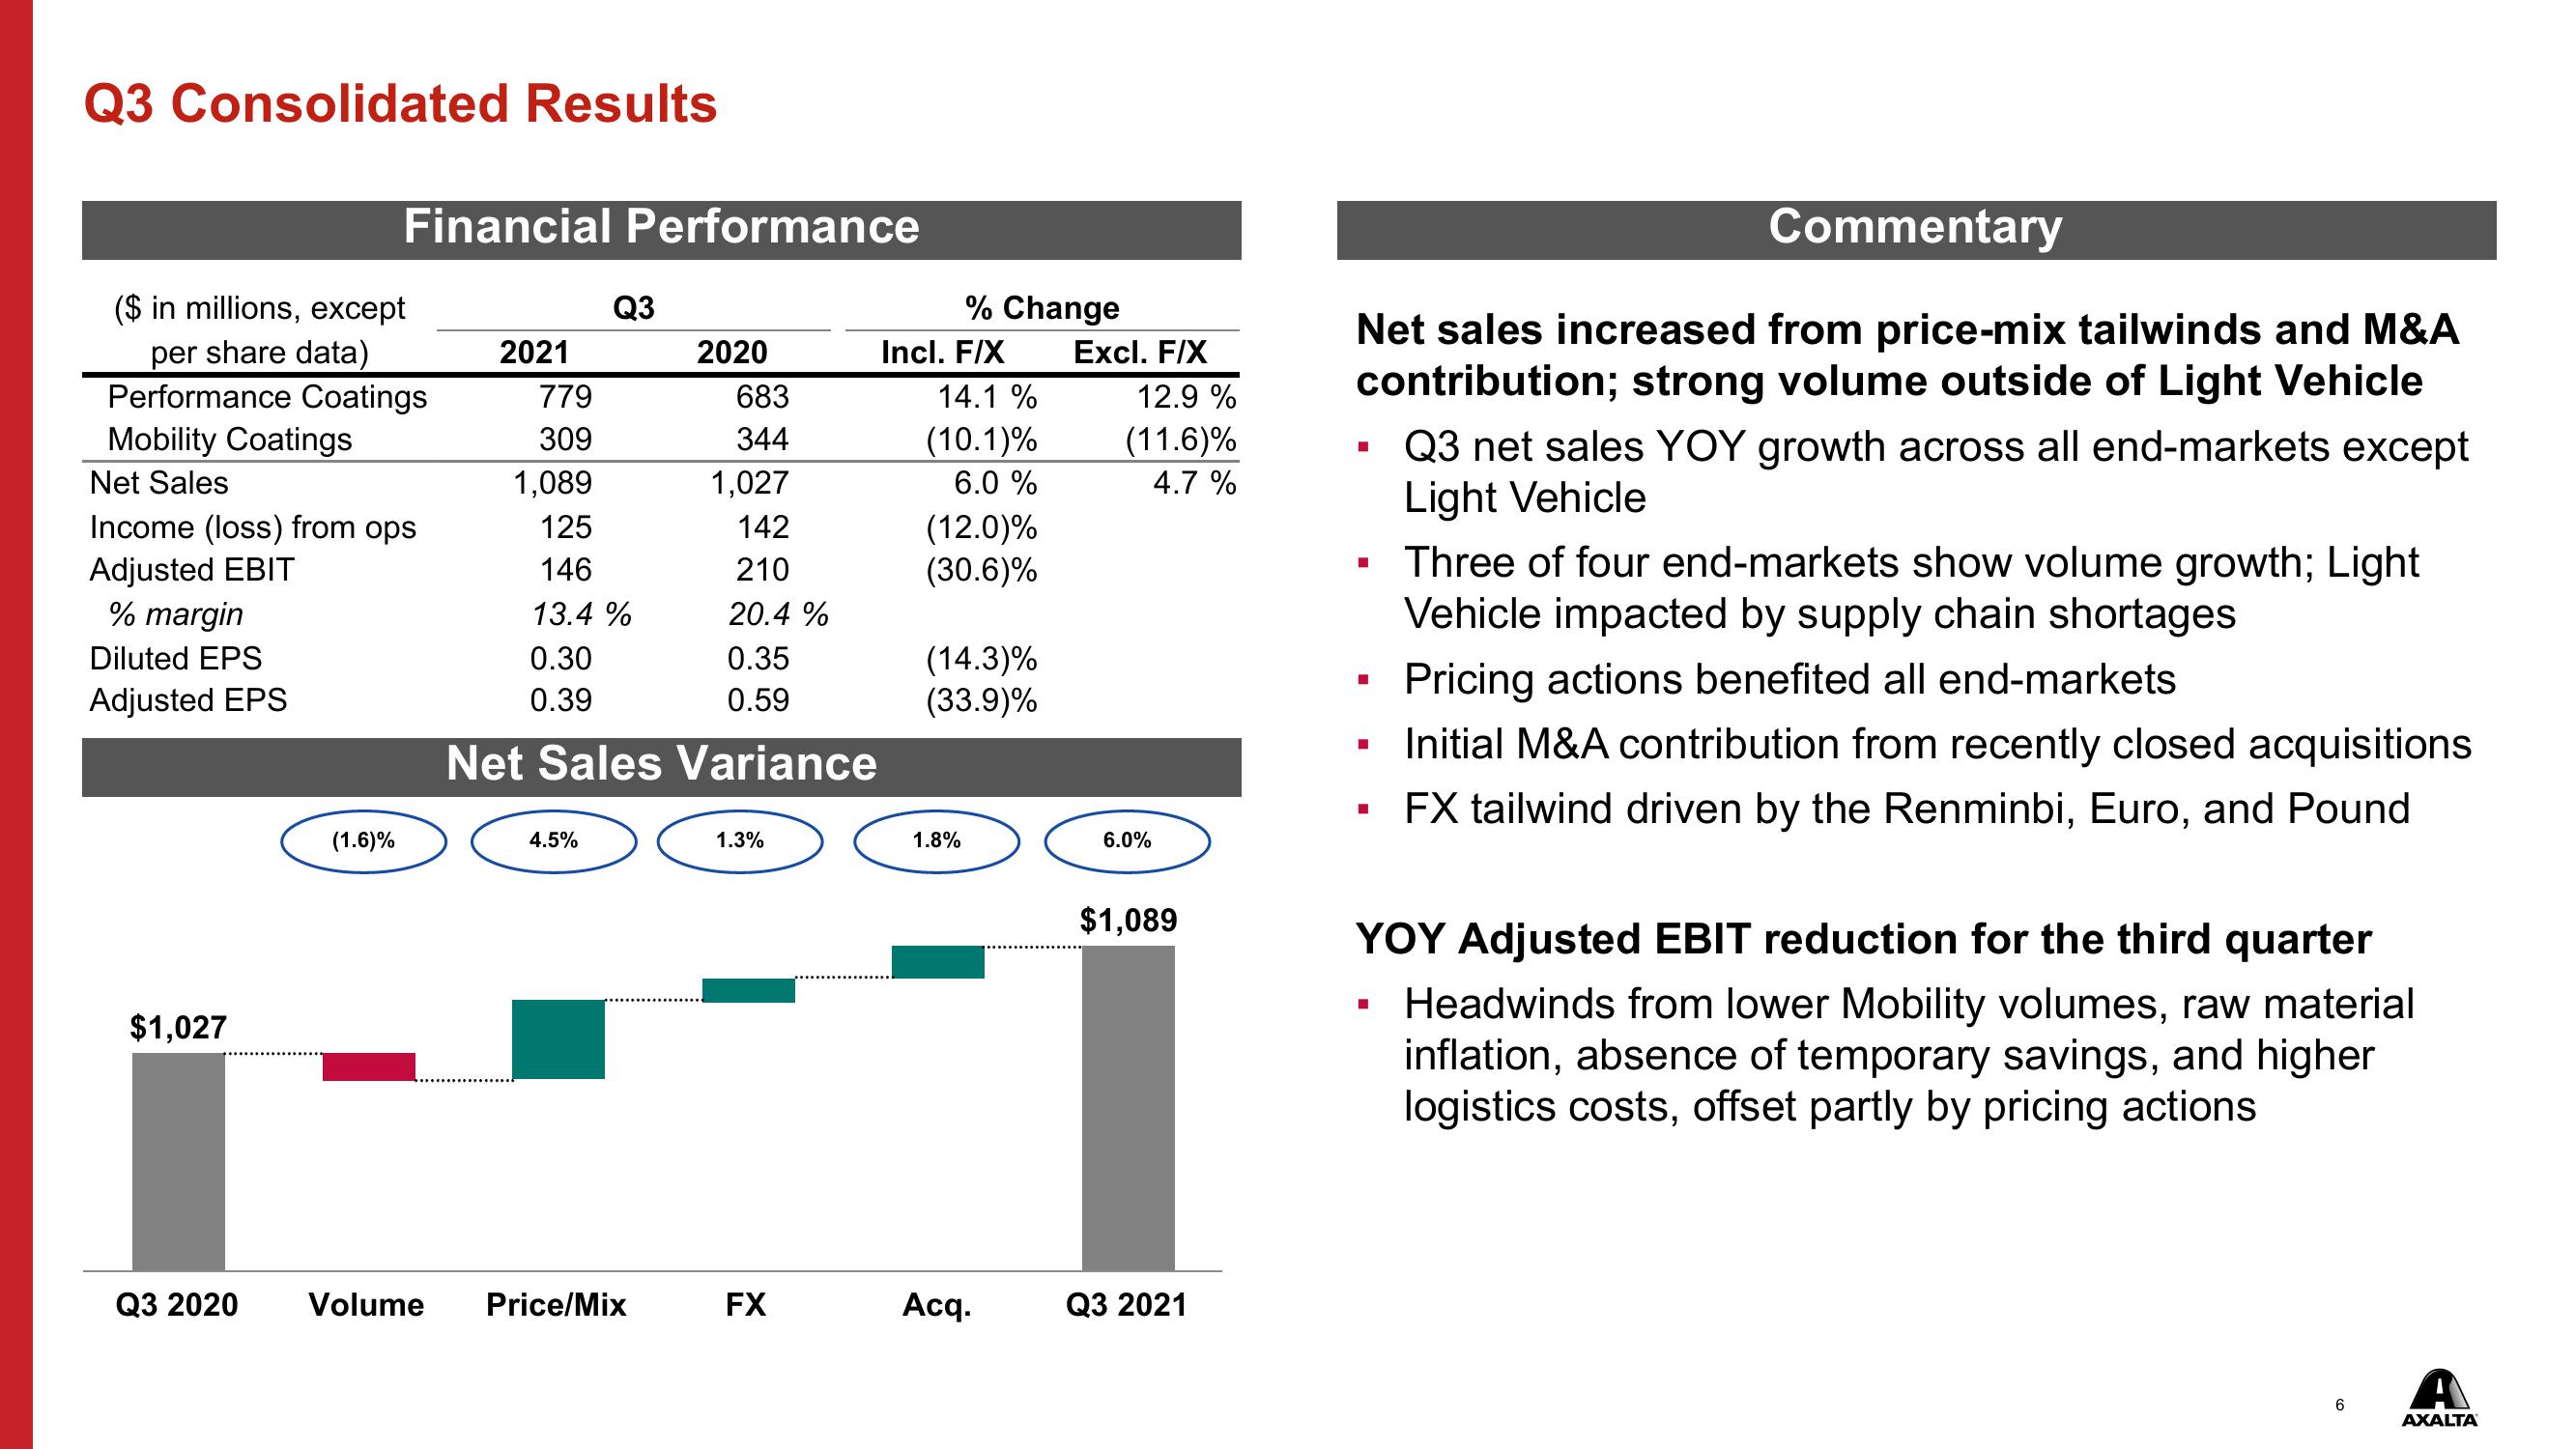
Net sales increased from price-mix tailwinds and M&A
contribution; strong volume outside of Light Vehicle
I
■
-
■
■
Q3 net sales YOY growth across all end-markets except
Light Vehicle
Three of four end-markets show volume growth; Light
Vehicle impacted by supply chain shortages
Pricing actions benefited all end-markets
Initial M&A contribution from recently closed acquisitions
FX tailwind driven by the Renminbi, Euro, and Pound
YOY Adjusted EBIT reduction for the third quarter
▪ Headwinds from lower Mobility volumes, raw material
inflation, absence of temporary savings, and higher
logistics costs, offset partly by pricing actions
6
A
AXALTAView entire presentation