ironSource SPAC Presentation Deck
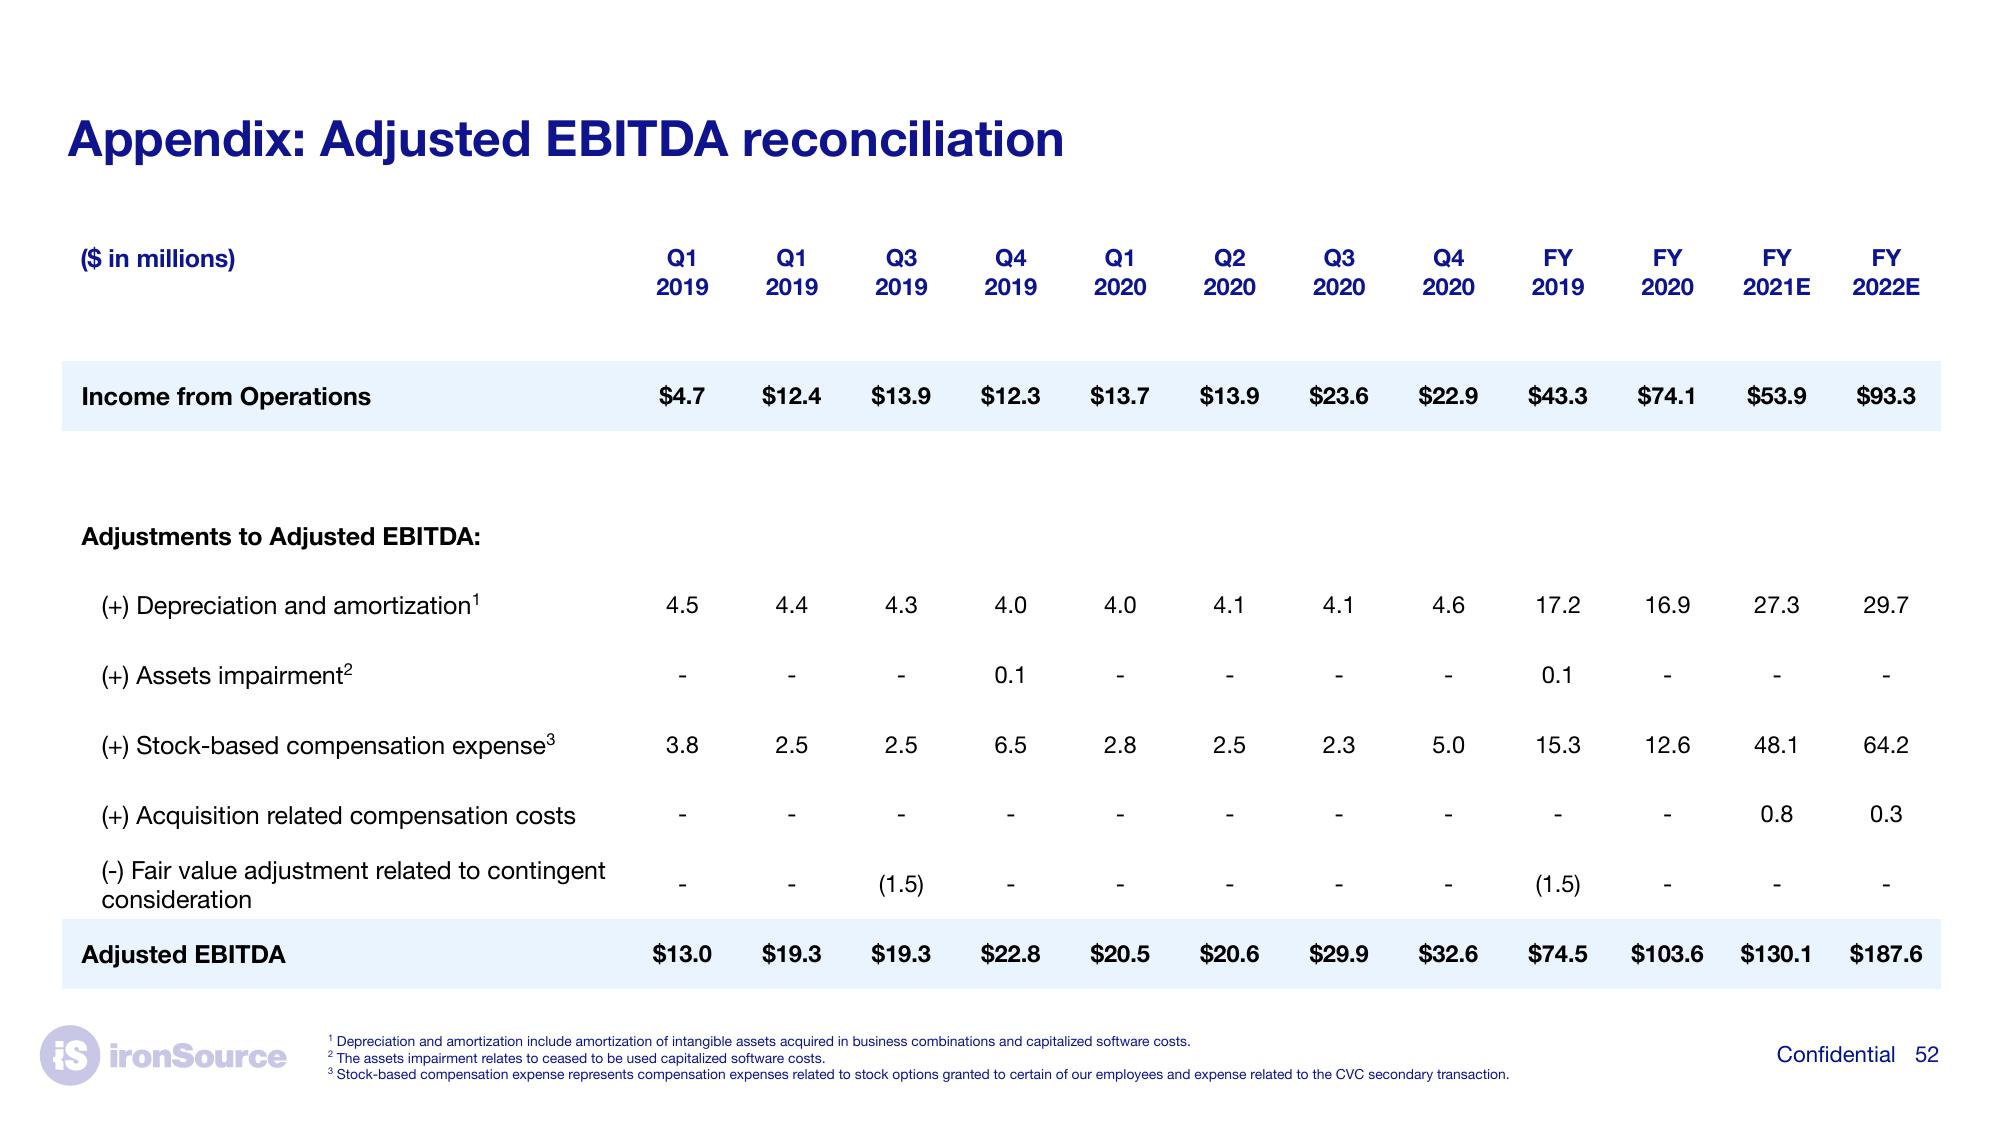
Appendix: Adjusted EBITDA reconciliation
($ in millions)
Income from Operations
Adjustments to Adjusted EBITDA:
(+) Depreciation and amortization¹
(+) Assets impairment²
(+) Stock-based compensation expense³
(+) Acquisition related compensation costs
(-) Fair value adjustment related to contingent
consideration
Adjusted EBITDA
IS ironSource
Q1
2019
$4.7 $12.4
4.5
3.8
Q1
2019
$13.0
4.4
1
2.5
$19.3
Q3
2019
$13.9 $12.3
4.3
2.5
Q4
2019
(1.5)
4.0
0.1
6.5
$19.3 $22.8
Q1
2020
$13.7
4.0
1
2.8
$20.5
Q2
2020
$13.9
4.1
2.5
Q3
2020
$23.6 $22.9
4.1
Q4
2020
2.3
4.6
5.0
$20.6 $29.9 $32.6
¹ Depreciation and amortization include amortization of intangible assets acquired in business combinations and capitalized software costs.
2 The assets impairment relates to ceased to be used capitalized software costs.
3 Stock-based compensation expense represents compensation expenses related to stock options granted to certain of our employees and expense related to the CVC secondary transaction.
FY
2019
$43.3
17.2
0.1
15.3
(1.5)
$74.5
FY
2020
$74.1
16.9
12.6
$103.6
FY
2021E
$53.9
27.3
48.1
0.8
$130.1
FY
2022E
$93.3
29.7
64.2
0.3
$187.6
Confidential 52View entire presentation