Netstreit Investor Presentation Deck
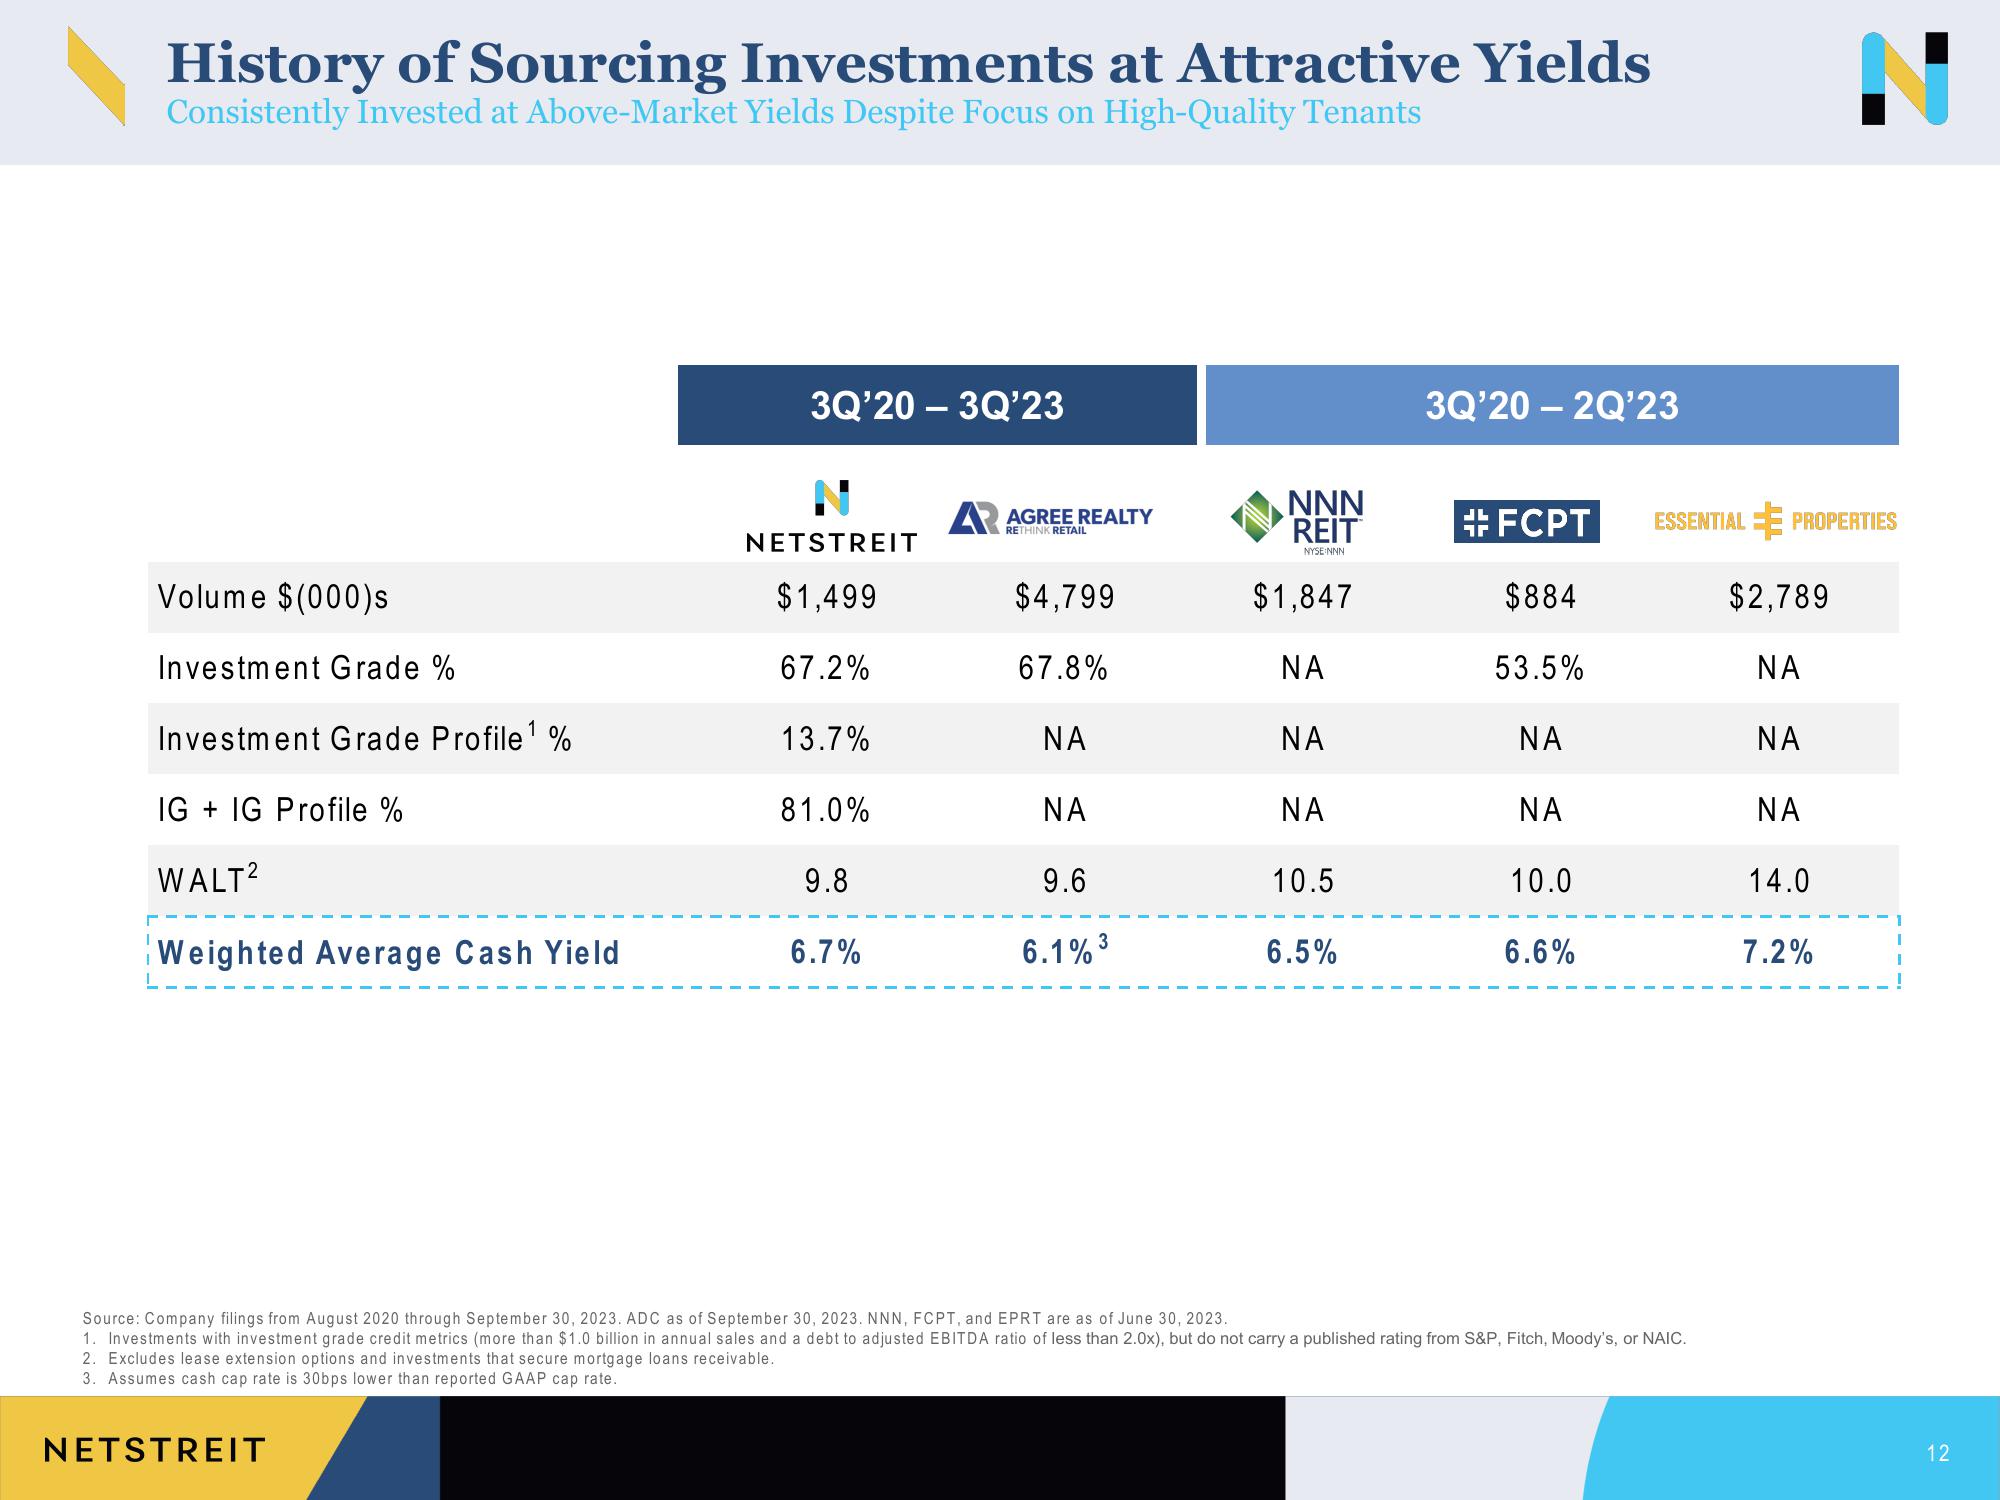
History of Sourcing Investments at Attractive Yields
Consistently Invested at Above-Market Yields Despite Focus on High-Quality Tenants
Volume $(000)s
Investment Grade %
Investment Grade Profile ¹ %
IG IG Profile %
WALT²
Weighted Average Cash Yield
3Q'20 - 3Q'23
NETSTREIT
NETSTREIT
$1,499
67.2%
13.7%
81.0%
9.8
6.7%
AR AGREE REALTY
RETHINK RETAIL
$4,799
67.8%
ΝΑ
ΝΑ
9.6
3
6.1% ³
NNN
REIT
NYSE:NNN
$1,847
ΝΑ
ΝΑ
ΝΑ
10.5
6.5%
3Q'20-2Q'23
#FCPT
$884
53.5%
ΝΑ
ΝΑ
10.0
6.6%
ESSENTIAL PROPERTIES
Source: Company filings from August 2020 through September 30, 2023. ADC as of September 30, 2023. NNN, FCPT, and EPRT are as of June 30, 2023.
1. Investments with investment grade credit metrics (more than $1.0 billion in annual sales and a debt to adjusted EBITDA ratio of less than 2.0x), but do not carry a published rating from S&P, Fitch, Moody's, or NAIC.
2. Excludes lease extension options and investments that secure mortgage loans receivable.
3. Assumes cash cap rate is 30bps lower than reported GAAP cap rate.
$2,789
ΝΑ
ΝΑ
ΝΑ
14.0
7.2%
12View entire presentation