Bausch+Lomb Results Presentation Deck
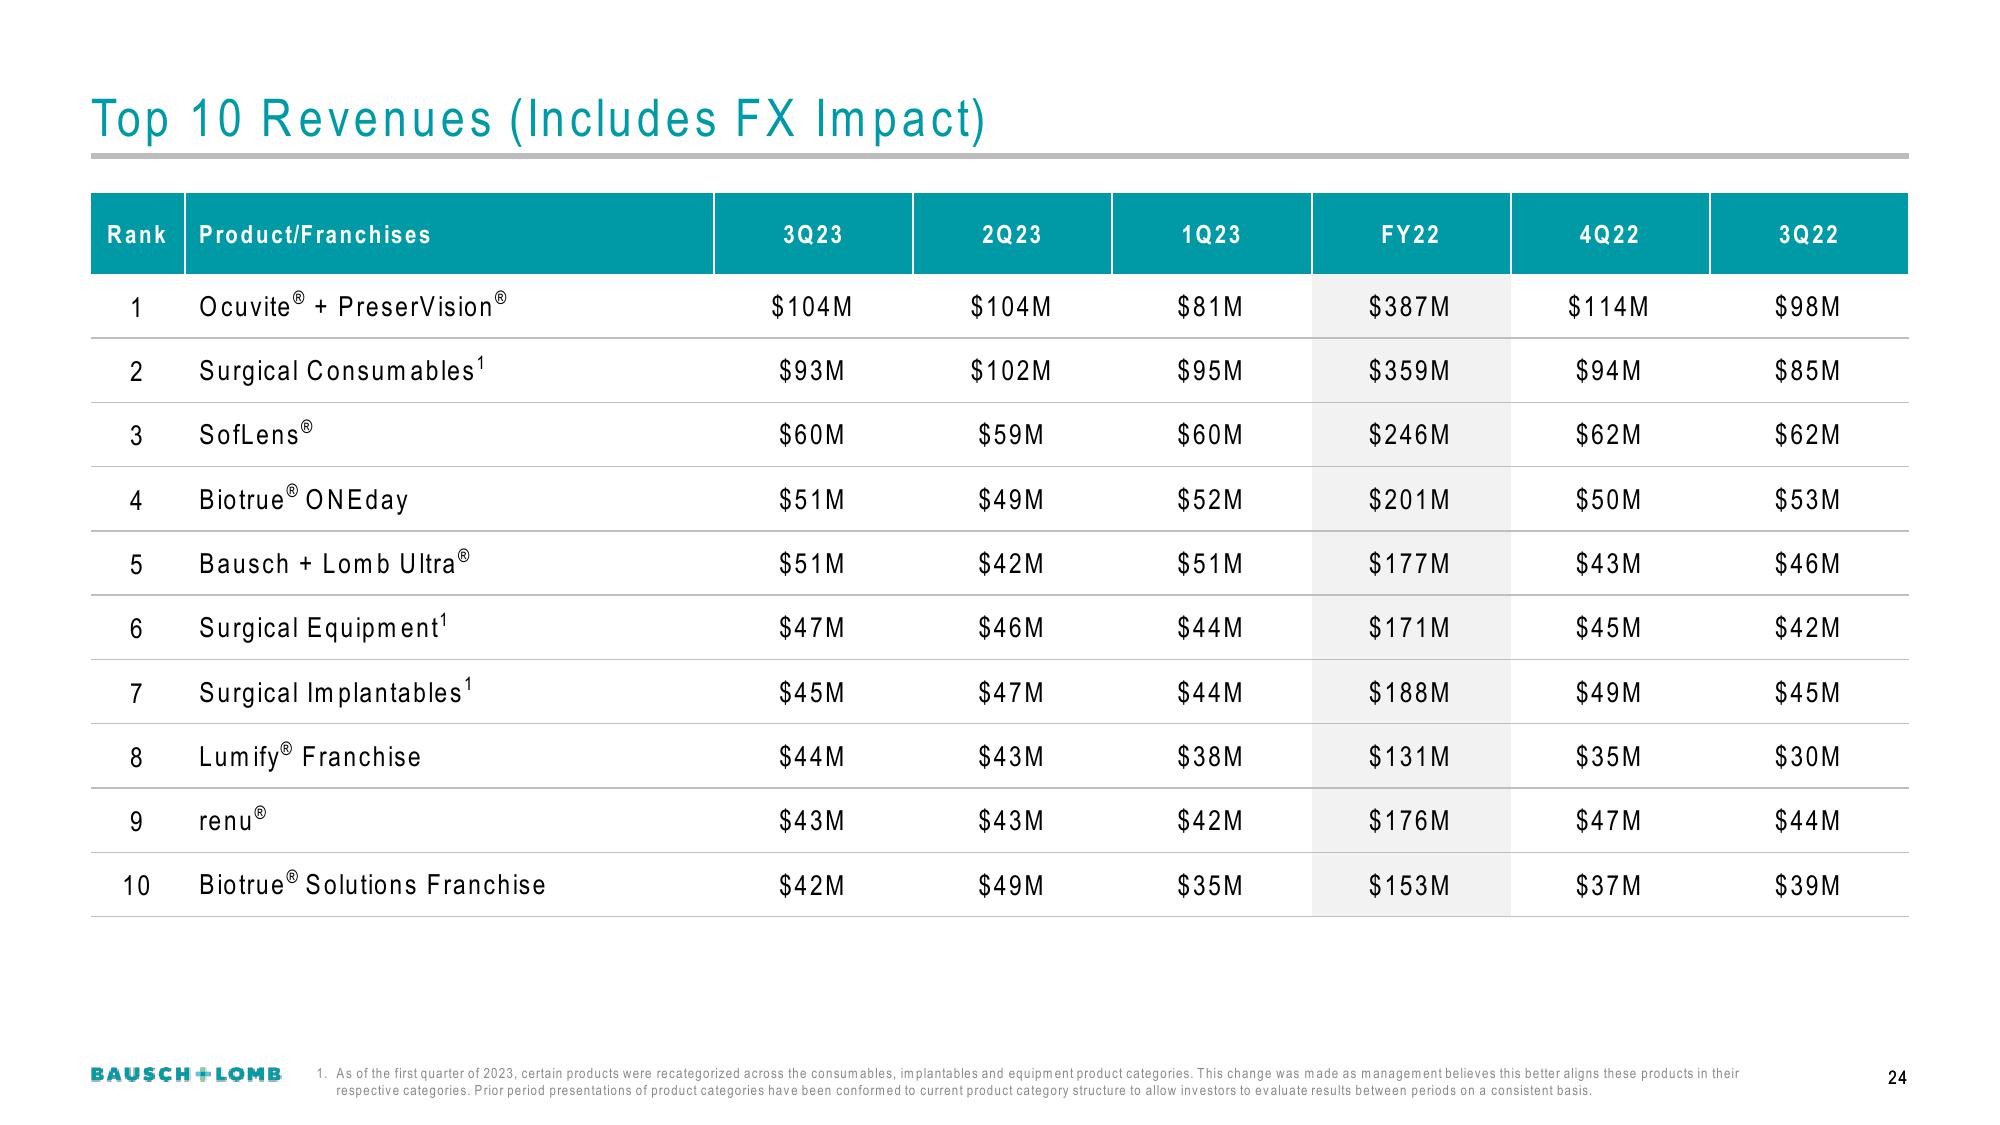
Top 10 Revenues (Includes FX Impact)
Rank Product/Franchises
1
2
3
4
6
5 Bausch+Lomb UltraⓇ
7
8
9
Ocuvite® + PreserVision®
Surgical Consumables¹
SofLens
Biotrue ONEday
10
Ⓡ
Surgical Equipment¹
Surgical Implantables¹
Lumify® Franchise
renu®
Biotrue® Solutions Franchise
BAUSCH+ LOMB
3Q23
$104 M
$93M
$60M
$51M
$51M
$47M
$45M
$44M
$43M
$42M
2Q23
$104M
$102M
$59M
$49M
$42M
$46M
$47M
$43M
$43M
$49M
1Q23
$81M
$95M
$60M
$52M
$51M
$44M
$44M
$38M
$42M
$35M
FY22
$387M
$359M
$246M
$201M
$177M
$171M
$188M
$131M
$176M
$153M
4Q22
$114M
$94M
$62M
$50M
$43M
$45M
$49M
$35M
$47M
$37M
1. As of the first quarter of 2023, certain products were recategorized across the consumables, implantables and equipment product categories. This change was made as management believes this better aligns these products in their
respective categories. Prior period presentations of product categories have been conformed to current product category structure to allow investors to evaluate results between periods on a consistent basis.
3Q22
$98M
$85M
$62M
$53M
$46M
$42M
$45M
$30M
$44M
$39M
24View entire presentation