WeWork Results Presentation Deck slide image

WeWork Results Presentation Deck

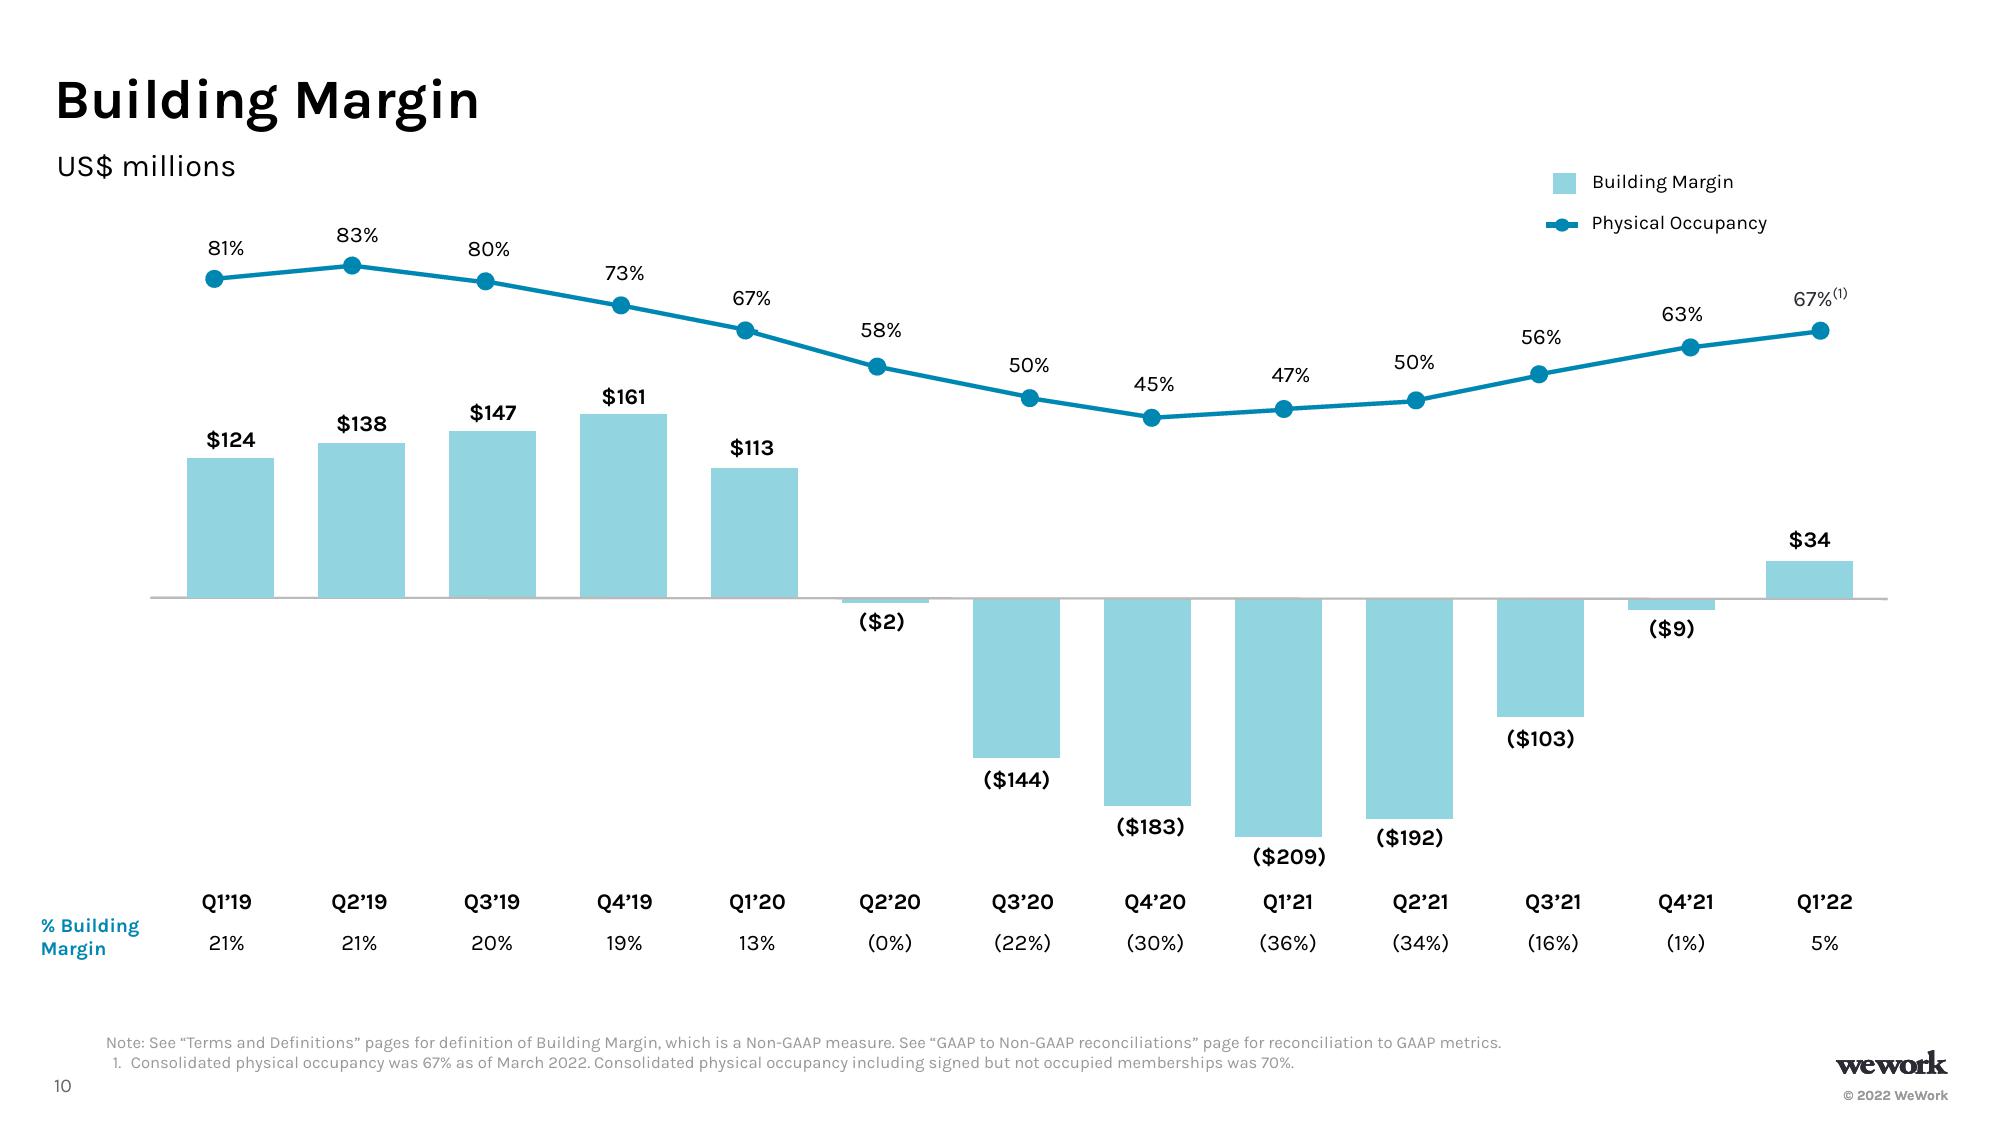
Building Margin US$ millions % Building Margin 10 81% $124 Q1'19 21% 83% $138 Q2'19 21% 80% $147 Q3'19 20% 73% $161 Q4'19 19% 67% $113 Q1'20 13% 58% ($2) Q2'20 (0%) 50% ($144) Q3'20 (22%) 45% ($183) Q4'20 (30%) 47% ($209) Q1'21 (36%) 50% ($192) Q2'21 (34%) Note: See "Terms and Definitions" pages for definition of Building Margin, which is a Non-GAAP measure. See "GAAP to Non-GAAP reconciliations" page for reconciliation to GAAP metrics. 1. Consolidated physical occupancy was 67% as of March 2022. Consolidated physical occupancy including signed but not occupied memberships was 70%. 56% ($103) Q3'21 (16%) Building Margin Physical Occupancy 63% ($9) Q4'21 (1%) 67% (1) $34 Q1'22 5% wework Ⓒ2022 WeWork
View entire presentation