Massachusetts Water Resources Authority (“MWRA”) Employees’ Retirement System
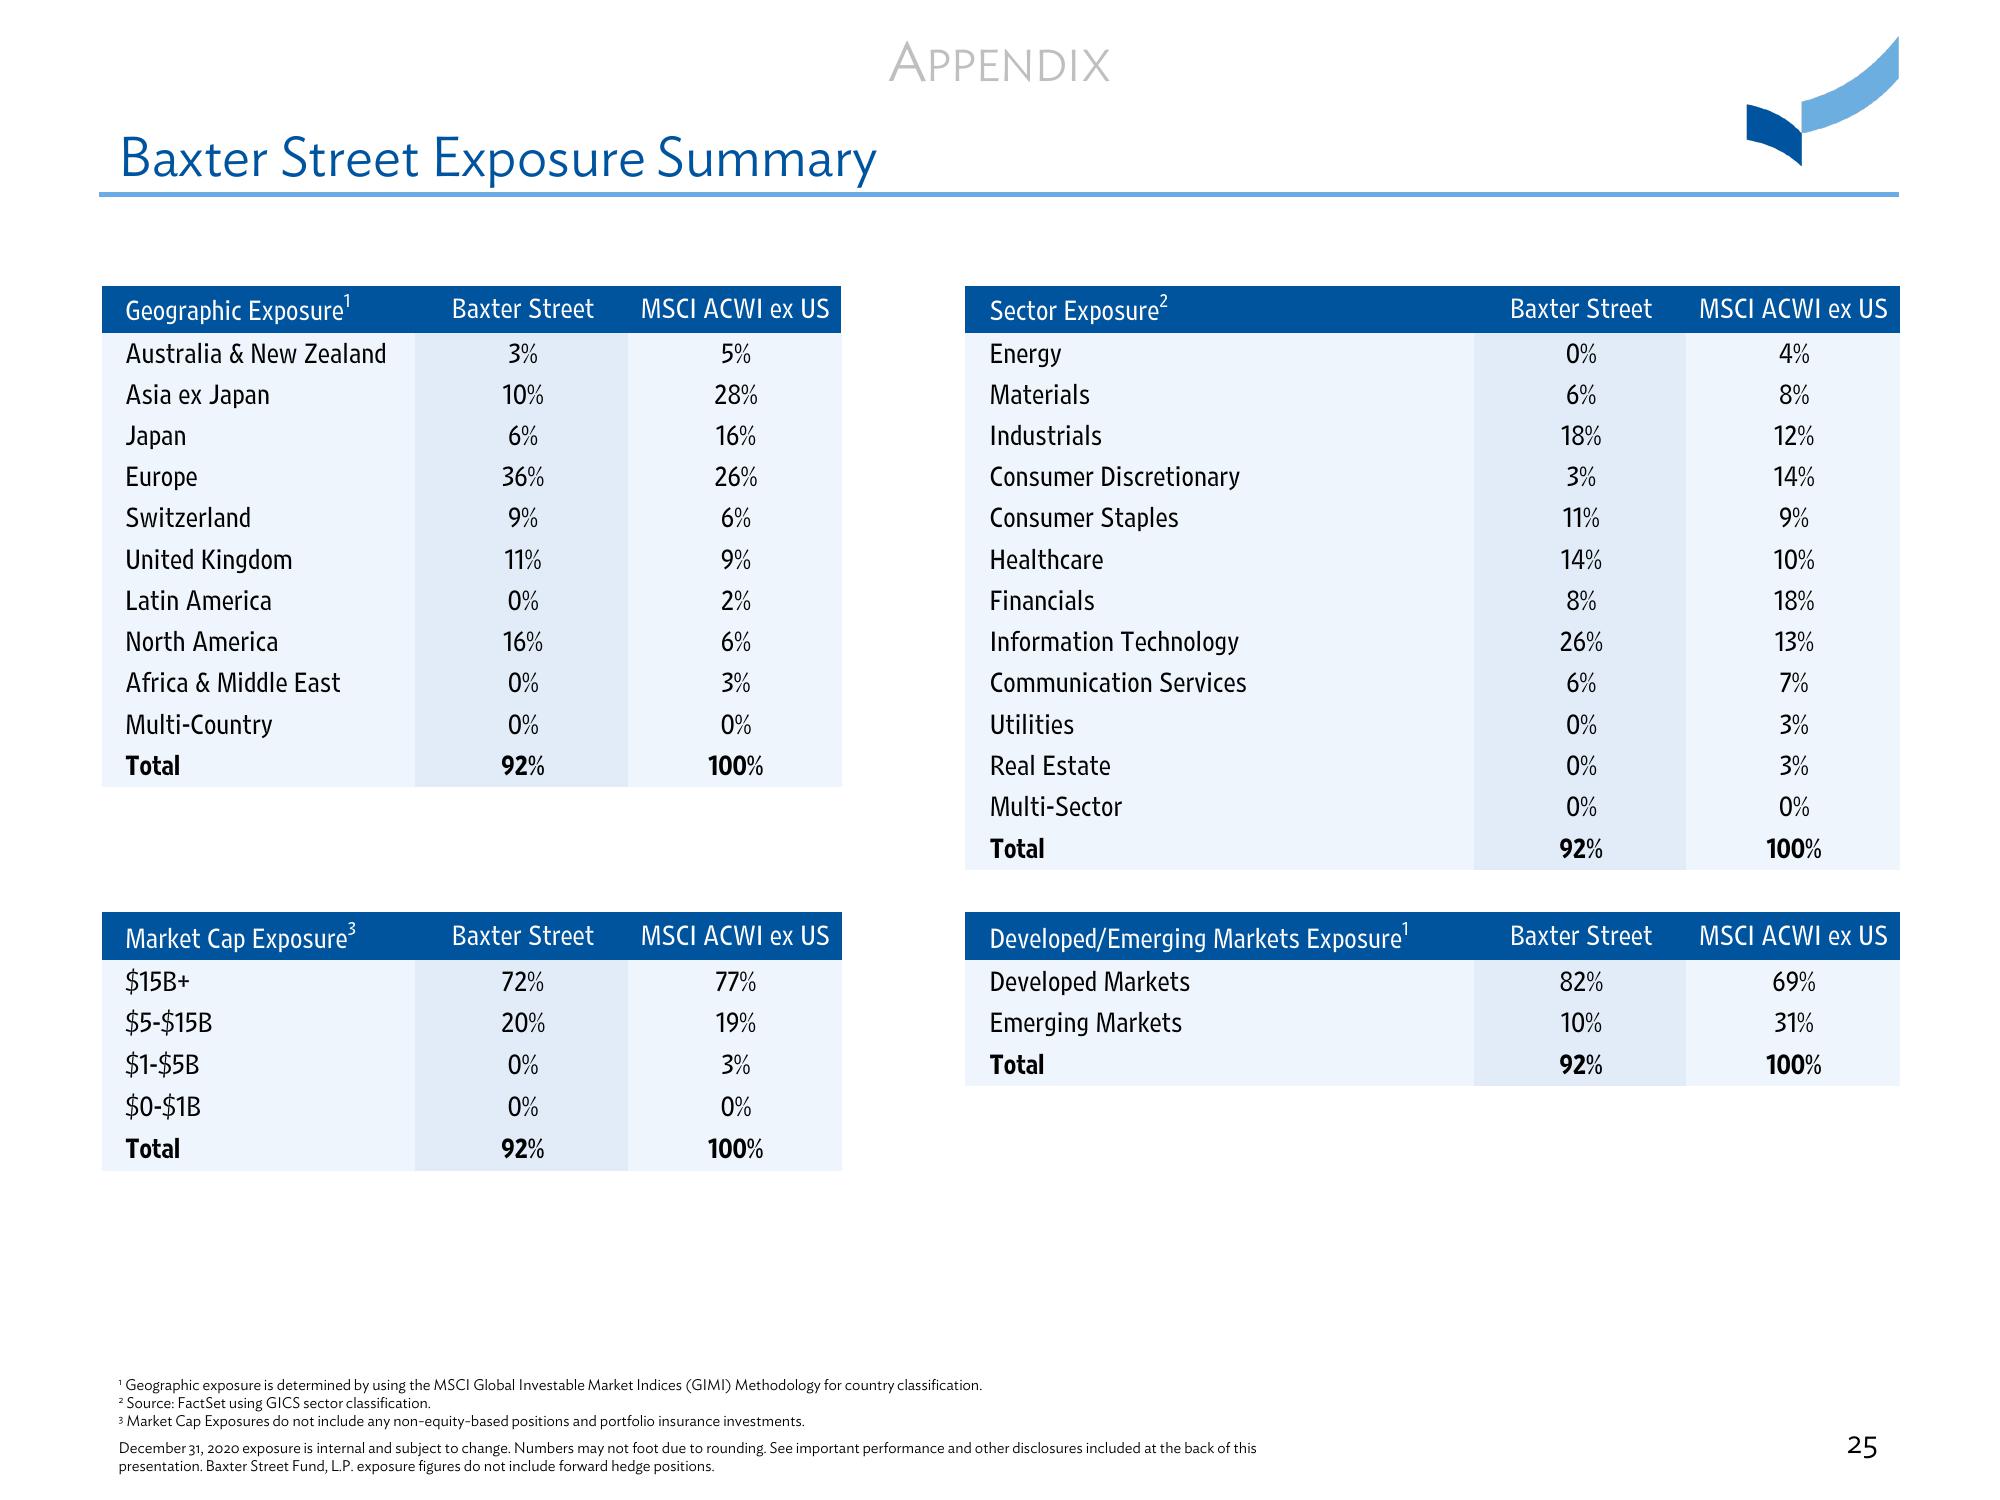
Baxter Street Exposure Summary
Geographic Exposure¹
Australia & New Zealand
Asia ex Japan
Japan
Europe
Switzerland
United Kingdom
Latin America
North America
Africa & Middle East
Multi-Country
Total
Market Cap Exposure³
$15B+
$5-$15B
$1-$5B
$0-$1B
Total
Baxter Street MSCI ACWI ex US
5%
28%
16%
26%
6%
9%
2%
6%
3%
0%
100%
3%
10%
6%
36%
9%
11%
0%
16%
0%
0%
92%
Baxter Street
72%
20%
0%
0%
92%
MSCI ACWI ex US
77%
19%
3%
0%
100%
APPENDIX
¹ Geographic exposure is determined by using the MSCI Global Investable Market Indices (GIMI) Methodology for country classification.
² Source: FactSet using GICS sector classification.
3 Market Cap Exposures do not include any non-equity-based positions and portfolio insurance investments.
Sector Exposure²
Energy
Materials
Industrials
Consumer Discretionary
Consumer Staples
Healthcare
Financials
Information Technology
Communication Services
Utilities
Real Estate
Multi-Sector
Total
Developed/Emerging Markets Exposure¹
Developed Markets
Emerging Markets
Total
December 31, 2020 exposure is internal and subject to change. Numbers may not foot due to rounding. See important performance and other disclosures included at the back of this
presentation. Baxter Street Fund, L.P. exposure figures do not include forward hedge positions.
Baxter Street
0%
6%
18%
3%
11%
14%
8%
26%
6%
0%
0%
0%
92%
Baxter Street
82%
10%
92%
MSCI ACWI ex US
4%
8%
12%
14%
9%
10%
18%
13%
7%
3%
3%
0%
100%
MSCI ACWI ex US
69%
31%
100%
25View entire presentation